

A data science problem solving framework is a structured methodology that translates ambiguous commercial objectives into mathematically tractable machine learning formulations, verifies data readiness, and delivers validated production models. Rather than jumping straight into algorithmic code, this discipline decouples what an organization needs from how a statistical model optimizes, systematically mitigating project failure before a single line of training script executes.
Organizations routinely burn capital by hiring elite data practitioners before defining their underlying technical reality. When leadership fails to distinguish between an exploratory inquiry and a production pipeline, teams waste months wrestling with broken schemas, unmeasured target variables, and misaligned expectations.
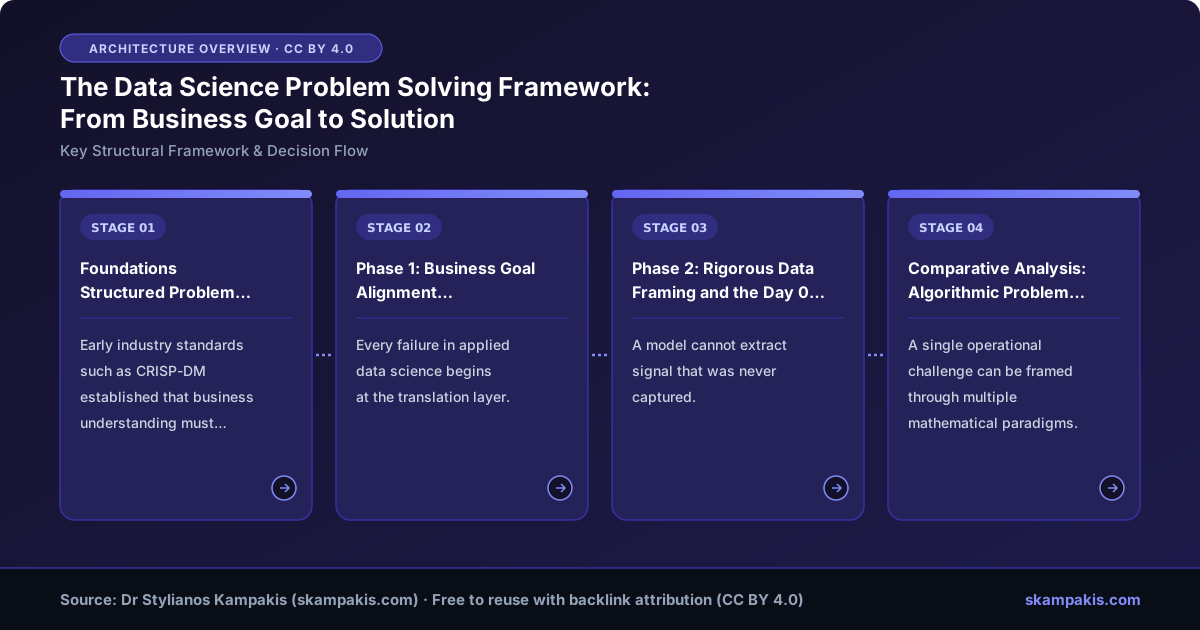
Foundations of Structured Problem Solving: Beyond Raw Algorithms
Early industry standards such as CRISP-DM established that business understanding must precede data preparation. However, modern enterprise velocity demands an operationalized analytics roadmap that treats algorithmic development as an engineering discipline rather than an academic sandbox.
A functional data framework prevents the common trap where businesses confuse tools with outcomes. Executive teams often request sophisticated neural architectures because of market hype, unaware that their underlying distribution requires straightforward regression or basic tabular heuristics.
To cultivate strategic impact, leaders must master Thinking Like a Data Scientist: The Strategic Decision Maker’s Guide, identifying which business bottlenecks genuinely benefit from machine learning versus operational rule systems.
Phase 1: Business Goal Alignment and Mathematical Translation
Every failure in applied data science begins at the translation layer. Business goal alignment requires peeling back executive phrasing to identify the actual optimization function required by the organization.
Consider a commercial objective like “profiting from digital assets.” Business executives frequently frame this as predicting absolute spot prices, which represents a notoriously noisy, high-entropy regression problem. In practice, the business simply needs to know directional momentum (classification) or execution timing through an algorithmic policy agent.
- Identify the actual intervention: Determine what specific operational decision will change once the model produces an output.
- Distinguish wants from needs: Separate vanity feature requests—such as demands for complex deep learning—from the operational objective.
- Deconstruct the unit economics: Calculate the financial delta between a baseline heuristic and an incremental 2% gain in algorithmic precision.
A classic symptom of misaligned formulation involves over-specifying architectures. Stakeholders often request recurrent neural networks or custom vision pipelines for tasks where simple user-supplied metadata tags or off-the-shelf endpoints would achieve superior latency. When complex computer vision is genuinely warranted, enterprise teams turn to pre-trained, robust foundation models rather than building bespoke classifiers from scratch, as detailed in why data science projects fail and how to build a high-ROI data culture.
Phase 2: Rigorous Data Framing and the Day 0 Strategy
A model cannot extract signal that was never captured. Rigorous data framing dictates that data collection architectures must be evaluated against the hypothesis before engineering starts—a principle known as data strategy from Day 0.
When organizations collect telemetry without an analytics blueprint, data scientists spend up to 80% of their tenure attempting to reconstruct unrecorded variables. An infamous example occurs when platforms attempt to analyze demographic disparities, such as gender pay equity, without ever asking users for their demographic status.
Attempting to infer missing baseline targets from secondary heuristics—such as guessing gender via first names—inevitably collapses when significant portions of the sample are unisex or ambiguous. The resulting imputation noise invalidates downstream statistical testing, forcing teams to scrap entire datasets.
- Target variable audit: Confirm that the target phenomenon is directly measured rather than loosely proxied by uncalibrated signals.
- Confounder identification: Map potential confounding variables that could distort causal inference or mask algorithmic bias.
- Observational control establishment: Ensure that control baselines exist within historical logs to measure incremental lift accurately.
This discipline applies directly across industrial internet-of-things (IoT) environments as well. As explored in preventing data collection problems in telemetry pipelines, attempting predictive maintenance without high-frequency baseline sampling yields sensor data incapable of isolating anomalous failure frequencies.
Comparative Analysis: Algorithmic Problem Formulations
A single operational challenge can be framed through multiple mathematical paradigms. In applied statistics, every modeling decision represents a trade-off between target resolution, sample complexity, and structural assumptions.
| Problem Archetype | Mathematical Framing | Primary Trade-Off | Best Operational Fit |
|---|---|---|---|
| Sports Injury Timeline | Continuous Regression | High resolution; volatile variance and skewed residual errors | Predicting exact recovery days with rich physiological data |
| Sports Injury Timeline | Multi-Class Classification | Lower temporal resolution (e.g., 1-week buckets); simpler loss landscape | Weekly roster management and basic clearance checks |
| Sports Injury Timeline | Survival Modeling | Strict hazard rate assumptions; smaller selection of off-the-shelf algorithms | Censored longitudinal tracking with dropouts over a season |
| Customer Churn Risk | Binary Classification | Ignores time-to-event dynamics; vulnerable to imbalanced classes | Triggering static re-engagement discounts within 30 days |
| Financial Asset Allocation | Reinforcement Learning | Extreme sample inefficiency; prone to reward function exploitation | High-frequency autonomous execution across volatile market regimes |
As demonstrated above, no single model architecture dominates unconditionally. Selecting between regression, classification, or survival analysis must be governed by how operational teams ingest the downstream inference.
Phase 3: Execution, Validation, and Stakeholder Interface
The breakdown in many applied initiatives occurs when non-technical stakeholders attempt to micromanage statistical modeling. Business sponsors frequently reject mathematically valid models because the coefficients or loss curves do not mirror intuitive, bivariate charts.
Consider a digital health intervention measuring physical activity levels before and after an application install. A robust multi-variable regression model isolates the installation effect by controlling for demographic confounders:
ActivityLevels = β0 + β1(AppInstallation) + β2(DemographicFactor1) + ... + ε
If the β1 coefficient exhibits statistical significance (p < 0.05), the application creates positive behavioral change. However, when stakeholders look at raw descriptive plots, the true underlying effect can be visually drowned out by confounding demographic interactions.
Demanding that data scientists “prove” multivariate models with simplistic two-variable charts forces teams to dilute analytical integrity. Reducing technical analysis to the lowest common denominator produces scientifically unsound conclusions. As researchers in interpretable machine learning demonstrate (Molnar et al., 2020), balancing interpretability and fidelity requires formal explainability tooling rather than oversimplified visualizations.
Handing over complex statistical modeling to untrained intuition is analogous to handing the controls of a space shuttle to a passenger. To navigate this friction, practitioners should implement a two-track communication interface:
- The Executive Explanatory Track: High-level visual dashboards, scenario simulators, and business KPI projections designed for capital allocators and board presentations.
- The Production Scientific Track: Fully parameterized, cross-validated econometric or machine learning pipelines running internally to drive automated decisions.
Critical Pitfalls in Problem-Solving Architecture
Navigating an enterprise data project requires strict adherence to analytical boundaries. The following anti-patterns represent the primary failure points in enterprise implementations:
- Algorithmic Solutionism: Selecting a modern architecture (e.g., Transformers or Diffusion) before framing the business optimization metric.
- Retroactive Schema Splicing: Attempting to impute missing primary business variables from unverified proxy features.
- Confounder Blindness: Relying on bivariate correlation charts to overturn multivariate significance testing.
- Scope Creep via Proxy Metrics: Shifting performance benchmarks mid-cycle because stakeholders misunderstand baseline normalization.
The Analytical Verification Checklist
Before moving any project from conceptual framing to model training, execute this end-to-end verification checklist:
- Problem Decoupling: Has the core business challenge been articulated without naming specific software libraries or algorithms?
- Variable Lineage: Are the primary dependent variables collected natively, or do they rely on heuristic imputation?
- Mathematical Framing: Has the data science team evaluated the trade-offs between regression, classification, and survival methods?
- Stakeholder Alignment: Do executive sponsors understand that raw visual plots may not mirror multivariate regression coefficients?
- Production Pathway: Is there an established two-track reporting cadence to satisfy investor relations without corrupting internal scientific validity?
Mastering the Data Science Problem Solving Framework
An enterprise does not achieve analytical maturity by training the largest possible model. Mature organizations systematically eliminate guesswork by adhering to an institutional data science problem solving framework that bridges executive strategy and mathematical rigor.
By enforcing Day 0 data hygiene, decoupling business goals from algorithmic mechanics, and respecting the domain boundaries between executive management and statistical computation, leadership teams turn unpredictable experiments into reproducible, revenue-generating software assets.
Frequently Asked Questions
What is the primary difference between a data science framework and an engineering pipeline?
A data science problem solving framework is a strategic methodology that governs problem formulation, data feasibility, mathematical framing, and business integration. An engineering pipeline refers to the technical infrastructure (ETL, CI/CD, feature stores) used to compute, train, and deploy the resulting code.
Why should organizations define their data strategy on Day 0?
Defining data strategy on Day 0 ensures that essential target variables and confounding factors are captured natively from the start. Collecting data without a strategic hypothesis forces teams to impute missing variables later, which frequently leads to discarded datasets and unrecoverable analytical investments.
How do you handle non-technical stakeholders who reject multivariate models?
Implement a two-track communication architecture. Provide stakeholders with intuitive, high-level dashboards and scenario visualizations for external reporting, while running methodologically rigorous, cross-validated multivariate models internally for automated decision-making.
How does problem framing differ between regression and classification?
Regression predicts a continuous quantitative value, offering high resolution but higher sensitivity to variance and outliers. Classification groups outcomes into discrete buckets, sacrificing granular precision in exchange for simpler optimization and easier operational decision-making.
Enterprise AI Strategy & Implementation Discovery Call
Scope practical AI workflows, human-in-the-loop governance, and measurable delivery milestones with Tesseract Consulting.