
Thinking like a data scientist means translating ambiguous organizational pain points into precise, testable questions, standardizing the data needed to evaluate them, and structuring workflows so empirical findings convert directly into measurable operational value. Rather than writing code or tuning hyperparameters, non-technical decision-makers drive the data science process by serving as the domain anchor who frames problems, oversees data integrity, and contextualizes analytical outcomes.
The Collaborative Engine: Domain Expert vs Data Scientist
Data science is frequently misunderstood across corporate hierarchies. Executives often treat it as a speculative revenue printer, customers perceive it as telepathic magic, and software engineers sometimes reduce it to calling external libraries. In practice, data science operates like a coordinated orchestra comprising infrastructure, software engineering, domain-specific data sources, and applied statistics.
While the full data science lifecycle spans collection, organization, analysis, interpretation, and communication, technical specialists are typically deployed only in the final stages. When quantitative teams arrive, data collection and organization have usually already taken place—often with unaddressed structural flaws.
Bridging this gap requires clear delineation between the primary actors: the domain expert and the data scientist. The domain expert owns the underlying business problem, understands operational nuances, and remains accountable for the outcome. The data scientist constructs mathematical models and executes statistical workflows to illuminate answers.
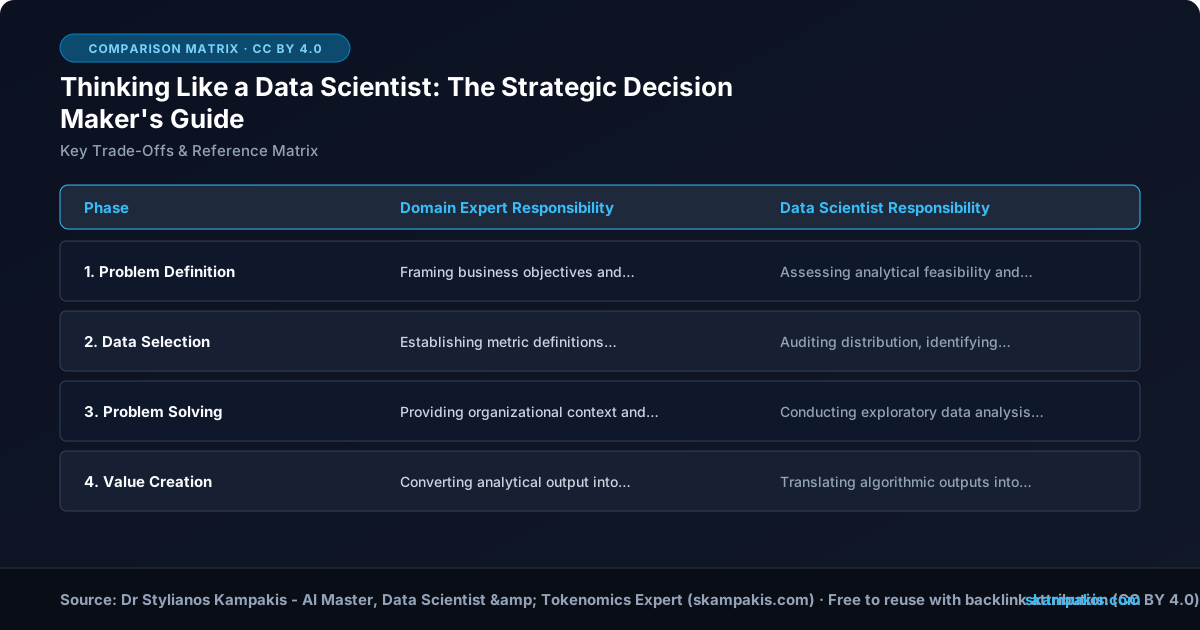
| Phase | Domain Expert Responsibility | Data Scientist Responsibility | Primary Deliverable |
|---|---|---|---|
| 1. Problem Definition | Framing business objectives and converting issues into bounded questions. | Assessing analytical feasibility and model boundary constraints. | Formal hypothesis document. |
| 2. Data Selection | Establishing metric definitions, provenance, and operational context. | Auditing distribution, identifying bias, and structuring inputs. | Validated data schema. |
| 3. Problem Solving | Providing organizational context and workflow access. | Conducting exploratory data analysis and developing predictive models. | Trained statistical model. |
| 4. Value Creation | Converting analytical output into business interventions and monetary metrics. | Translating algorithmic outputs into interpretable business parameters. | Actionable insights and KPI uplift. |
The Four-Step Data Science Process
Executing an analytics initiative does not require executive fluency in Python or linear algebra. It demands discipline across four sequential stages that bridge technical modeling with organizational strategy.
Step 1: Defining the Problem
The foundation of any analytical effort rests entirely on defining the problem with surgical precision. Non-technical professionals often think in broad, qualitative generalities, whereas machine learning models, statistical distributions, and optimization algorithms are engineered to answer exceptionally narrow queries.
To eliminate ambiguity, translate vague workplace grievances into singular, verifiable interrogatives. If stakeholders cannot articulate the baseline question, an engineering team cannot engineer a target metric.
Step 2: Choosing the Right Data and Avoiding Collection Traps
Selecting analytical inputs requires acute awareness of operational mechanics. Every business sector introduces idiosyncratic noise. For example, industrial telemetry requires specific filtering techniques, to prevent data collection problems that ruin machine learning before modeling begins, whereas human survey data routinely suffers from social desirability bias and uncalibrated subjective scales.
Managing this stage involves two distinct operational activities:
- Conceptual Data Auditing: Establishing explicit semantic boundaries for what each variable represents before gathering observations.
- Active Data Collection: Tracking collection mechanisms while actively guarding against dirty data collection artifacts such as omitted variables, manual entry discrepancies, and shifting sampling conditions.
Step 3: Solving the Problem
Model creation is primarily the domain of the data scientist, yet the domain expert must understand the analytical trajectory. Modern practitioners typically structure their methodology around established frameworks such as the CRISP-DM process model, beginning with comprehensive exploratory data analysis (EDA).
Through summary metrics, quantile calculations, and density plots, the analyst uncovers baseline distributions and preliminary correlations. From there, they train algorithms designed specifically to answer the core question framed during the initial phase.
Step 4: Creating Value Through Actionable Insights
An algorithm provides no commercial utility while resting in a notebook or code repository. The combined team must transform model coefficients and confidence intervals into concrete operational decisions. True value emerges only when analytical findings are translated into unit economics, resource reallocations, or targeted behavioral interventions.
Thinking Like a Data Scientist in Practice: The Meeting Latency Diagnostic
To understand how this dynamic works in the real world, consider an everyday workplace friction point: internal meetings that never seem to start on schedule.
Framing the Diagnostic Question
A non-analytical manager usually approaches this issue with a sweeping assertion: “Our company culture is broken because our meetings are always disorganized and late.”
A decision-maker applying the data science process immediately reframes the frustration into a testable hypothesis: “Meetings scheduled across department teams consistently start after their appointed calendar time. Is this statistically true, and what is the distribution of that delay?”
Navigating Semantic Drift and Dirty Data
Before recording timestamps, the domain expert must explicitly define the term “start.” Does a meeting start when the conference room software connects? Does it start when the organizer calls for order? Or does it begin only when preliminary social banter concludes and the agenda is actively addressed?
Imagine an observer initially logs meeting start times the moment the video conference link activates. Halfway through the evaluation period, they realize that small talk consistently consumes 15 minutes before work discussions begin. If they alter their recording protocol to capture the end of small talk without logging the procedural adjustment, the dataset becomes fatally compromised.
The resulting dataset now contains a single variable representing two completely different physical phenomena. A statistical model evaluating this unstratified data will produce invalid variance estimates, severely compromising downstream interventions.
Extracting Actionable Insights from Statistical Distributions
When the data scientist performs exploratory data analysis on the clean log, the findings replace assumptions with hard facts. For instance, the data might demonstrate that only 10% of sessions begin at the scheduled minute, with a median delay of 12 minutes.
Secondary questions then emerge organically from the baseline results:
- Variable Correlation: Does meeting latency correlate with the presence of specific department leads or particular cross-functional agendas?
- Temporal Asymmetry: Are chronic delays in morning sessions counterbalanced by afternoon meetings ending ahead of schedule?
- Operational Costing: What is the company-wide financial impact when aggregated delay time is multiplied across employee hourly compensation bands?
Armed with these quantitative findings, leadership can abandon broad organizational complaints in favor of targeted adjustments: establishing standard 25-minute meeting blocks, introducing strict conversational agendas, or providing time-management coaching to specific functional teams.
Implementation Pitfalls and Data Hygiene Rules
Business teams embarking on internal analytics initiatives routinely encounter preventable failure points. Maintaining strict process governance prevents expensive analytical misfires.
- The Metric Drift Trap: Changing how operational variables are calculated mid-stream without updating historical schemas splits your time-series data into incompatible eras.
- The Passive Sunk-Cost Fallacy: Continuing data collection on flawed definitions rather than halting the pipeline to correct the underlying logging mechanism wastes both time and developer resources.
- The Translation Failure: Presenting raw model metrics (such as Root Mean Squared Error or F1 scores) directly to executive sponsors rather than converting outcomes into risk exposure or cost calculations halts organizational adoption.
Strategic Governance Checklist for Decision Makers
Before commissioning an internal analytics team or hiring outside data science consultants, verify that your project foundation satisfies these essential operational criteria:
- Clear Hypothesis Formulation: The core problem is articulated as a closed-ended question focused on a verifiable outcome.
- Semantic Schema Freezing: Core terminology, operational metrics, and logging events have written definitions that remain consistent across all recording periods.
- Data Auditability: Collection mechanisms capture edge cases, structural missing values, and environmental noise rather than masking them.
- Pre-Defined Success Thresholds: The business unit has established precisely which numeric outputs justify making an operational change.
Mastering the fundamentals of thinking like a data scientist does not mean replacing technical experts; it means providing the clear strategic direction they need to succeed. By defining problems accurately, maintaining clean data collection environments, and translating technical discoveries into commercial value, business leaders transform raw analytical output into lasting competitive advantages.
Frequently Asked Questions
Do managers need to know how to code to think like a data scientist?
No. Strategic data science focuses on logical problem framing, systematic metric definition, and empirical validation. Managers need to know how models are trained and how their inputs are measured, but they do not need to write production code or execute mathematical proofs themselves.
What is the biggest point of failure in corporate data science projects?
The most common failure occurs during Step 1: problem definition. When organizations hand data scientists ambiguous mandates—such as “find insights in our customer data”—the resulting models rarely solve practical operational challenges or generate measurable business value.
How does dirty data differ from insufficient data?
Insufficient data means your sample size is too small to build statistical confidence. Dirty data means your records contain false values, undocumented collection adjustments, inconsistent variable definitions, or systemic measurement biases that will invalidate an analysis regardless of sample size.
In-House Corporate AI Strategy & Governance Clinics
Bespoke executive clinics led by Dr. Stylianos Kampakis for leadership teams, boards, and division directors.