

Statistical intuition for decision makers is the operational ability to separate substantive business signals from mathematical noise, flawed sampling, and deceptive visualizations without getting lost in algorithmic complexity. Rather than accepting dashboard metrics at face value, leaders with strong statistical intuition evaluate the underlying data-generating process, verify experimental assumptions, and assess whether observed effects drive real commercial impact.
Modern organizations drown in executive dashboards, automated forecasting models, and A/B testing platforms. However, computational access to data does not guarantee clarity. When teams confuse correlation with causation, game significance thresholds, or misinterpret measures of central tendency, strategic initiatives fail.
Developing practical intuition requires mastering the analytical models driving your business, recognizing visual and mathematical distortion, and prioritizing robust inferential metrics over vanity numbers.
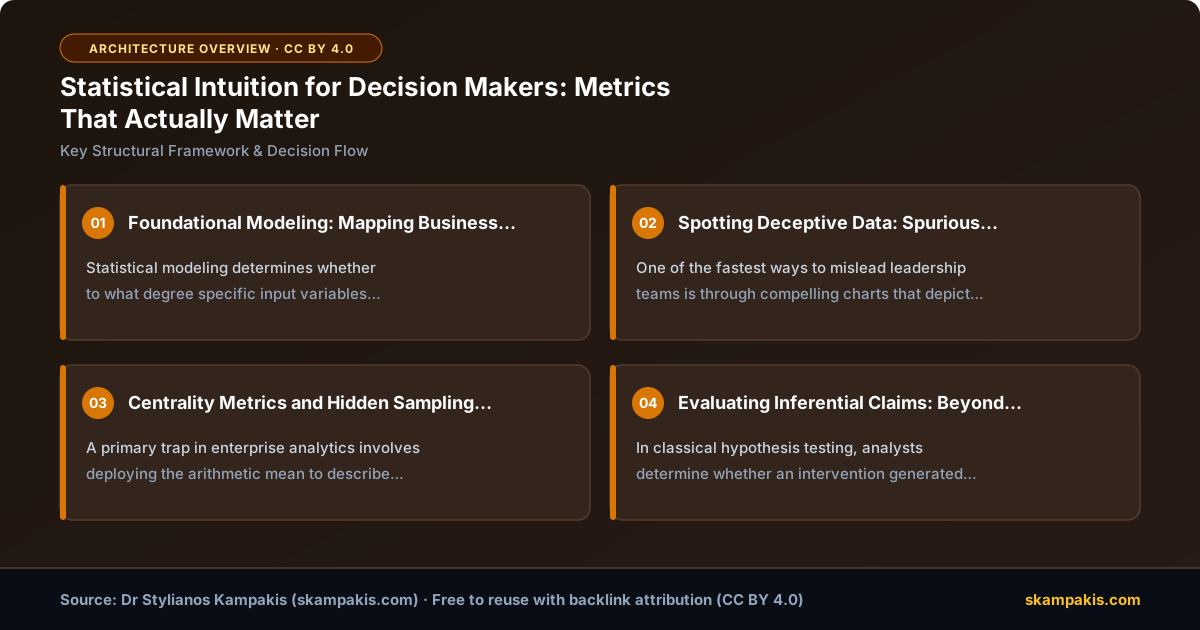
Foundational Modeling: Mapping Business Variables to Statistical Reality
Statistical modeling determines whether and to what degree specific input variables influence a target business outcome. When evaluating why male and female compensation differs in an enterprise, a simple comparison of averages is insufficient. Leaders employ regression models to isolate the marginal effects of age, tenure, previous role hierarchy, and regional benchmarks.
Selecting the incorrect model architecture distorts strategic planning from the outset. Business leaders must recognize which model class corresponds to their operational data structures:
| Model Architecture | Target Variable (Y) Type | Enterprise Business Use Case | Primary Assumption / Risk |
|---|---|---|---|
| Multiple Linear Regression | Continuous, unbounded numeric | Forecasting customer lifetime value (LTV) or revenue run-rate | Assumes linear relationships and homoscedastic residual variance |
| Logistic Regression | Binary categorical (0 or 1) | Predicting churn risk, fraud probability, or lead conversion | Assumes log-odds linearity; sensitive to extreme class imbalance |
| Poisson Regression | Discrete, non-negative count data | Calculating support ticket volume, facility footfall, or server faults | Assumes mean equals variance; overdispersion requires Negative Binomial |
| Survival Modeling | Time-to-event duration (censored) | Anticipating mechanical part failure or contract cancellation timing | Requires handling censored records where failure has not yet occurred |
| Log-Linear Modeling | Multivariate contingency counts | Evaluating demographic segment interactions across marketing channels | Requires categorical discretization; vulnerable to cell sparsity |
Deploying these models requires a firm grasp of disciplinary priorities. While pure machine learning optimizes predictive accuracy—often treating internal mechanisms as black boxes—classical statistics prioritizes model interpretability and causal inference. If your executive mandate requires explaining why revenue declined, interpretability must supersede pure algorithmic fit. For an exhaustive perspective on developing this mindset across leadership teams, see our guide on Thinking Like a Data Scientist: The Strategic Decision Maker’s Guide.
Spotting Deceptive Data: Spurious Correlations and Visual Distortion
One of the fastest ways to mislead leadership teams is through compelling charts that depict spurious correlations. Two unrelated metrics can trend together over time purely by coincidence or through shared confounding factors.
Tyler Vigen famously demonstrated that the annual number of people who drowned by falling into a swimming pool closely tracks the number of films Nicolas Cage appeared in between 1999 and 2009. Similarly, U.S. spending on science, space, and technology correlates tightly with national suicides by hanging, strangulation, and suffocation (Tyler Vigen, Spurious Correlations Research). In both instances, there is zero theoretical mechanism linking the phenomena. Running predictive algorithms without an underlying domain theory produces commercial hallucinations.
Visual presentation methods frequently disguise structural flaws in corporate reporting:
- Truncated and Inverted Axes: Reversing an axis scale or altering the baseline from zero exaggerates flat performance or hides steep drop-offs, misleading quarterly evaluations.
- Unannounced Logarithmic Transformations: Log scales compress orders of magnitude. Using logarithmic scaling without clear disclosure makes high-variance outliers look deceptively close to median performance.
- The Zoom Illusion: Tightening the vertical bounds on a line chart magnifies routine random volatility, falsely portraying stable processes as major organizational crises.
Centrality Metrics and Hidden Sampling Biases
A primary trap in enterprise analytics involves deploying the arithmetic mean to describe skewed distributions. In a symmetrical normal distribution, the mean, median, and mode coincide. In corporate operational metrics—such as salaries, user transaction values, and customer onboarding times—distributions are almost universally skewed.
Consider a department where one executive earns $300,000 annually and ten team members earn $50,000 each. The median compensation is $50,000, but the mean compensation is $72,727. Reporting the mean paints an artificially optimistic picture of employee earnings. Pragmatic leaders mandate median values and interquartile ranges when evaluating skewed systems.
Beyond descriptive metrics, systematic sampling biases silently invalidate strategic decisions before analysis even begins:
- Selection Bias: The sample population systematically differs from the target population. During World War II, statistician Abraham Wald noted that military analysts reinforced armor on surviving planes where bullet holes clustered. Wald recognized that aircraft shot in vital components never returned to be sampled (Abraham Wald, A Method of Estimating Plane Vulnerability to Ammunition Hits). True vulnerability lay precisely where the survivors were pristine.
- Self-Selection Bias: Participants choose whether to contribute based on intrinsic motivations. Voluntary customer feedback surveys capture responses exclusively from passionate brand advocates or frustrated detractors, entirely missing the neutral majority.
- Area and Cultural Bias: Assuming performance dynamics discovered in one geographic market automatically generalize across regions with divergent cultural and economic baselines.
- Leading Question Bias: Framing prompts to manipulate sentiment, such as asking “Should our underpaid customer support reps receive bonuses?” rather than neutral policy questions.
- Social Desirability Bias: Respondents overreport virtuous actions (such as compliance adherence or green purchasing) to meet perceived social standards, skewing market validation tests.
Similar compounding biases degraded national polling methodologies during both the 2016 American Presidential Election and the UK Brexit referendum, where nonresponse bias among specific demographic segments skewed predictive models.
Evaluating Inferential Claims: Beyond the Cult of the P-Value
In classical hypothesis testing, analysts determine whether an intervention generated real change by computing p-values. When a p-value falls below an arbitrary alpha threshold (typically 0.05), the outcome is declared to have statistical significance. However, blind reliance on this threshold creates systemic failures.
The enterprise risks of significance-focused decision-making stem from structural incentives:
- P-Hacking and Data Dredging: Running dozens of cross-segment tests until a single sub-cohort arbitrarily clears the p < 0.05 threshold through random variation, then reporting that singular test as a planned discovery.
- The Significance vs. Magnitude Disconnect: Large sample sizes drive p-values downward. A feature change evaluated on five million users might show p = 0.0001 for an average revenue lift of just $0.0002 per user. The result is statistically significant, but commercially trivial.
- Prior Neglect: Frequentist testing assumes repeated identical experiments under stationary conditions. It cannot naturally encode prior baseline knowledge, treating a wildly improbable claim with the exact same mathematical machinery as an operationally proven mechanism.
To avoid these traps, teams should replace isolated significance tests with confidence intervals and posterior Bayesian evaluations. Confidence intervals explicitly display the effect size and directional uncertainty, forcing decision-makers to evaluate both best- and worst-case performance scenarios.
Implementation Playbook: Operationalizing Statistical Intuition
Building disciplined statistical rigor across an organization requires a structured operational sequence. Follow this chronological execution guide when auditing operational data initiatives:
Phase 1: Establish Theoretical Ground Truth
Define the formal business hypothesis before inspecting output dashboards. Identify the theoretical causal pathway linking input variable X to response variable Y. If marketing spend is expected to drive sales pipeline, map out the conversion milestones. Reject metric correlations that lack a credible operational mechanism.
Phase 2: Audit the Sampling Architecture
Audit how records enter the analysis pipeline. Screen the sample for nonresponse attrition, voluntary opt-in skew, and regional selection discrepancies. Verify that surviving records are not concealing critical systemic failures, as observed in historical survivorship models. Check for missing counterfactuals.
Phase 3: Validate Model Assumptions and Distributions
Plot the underlying distribution of target variables prior to modeling. If data is positively skewed, retire the mean and establish the median and interquartile spread as the primary business metrics. Verify that linear regressions do not attempt to predict bounded integer counts, and confirm that binary outcomes use appropriate link functions.
Phase 4: Run Uncertainty and Impact Checks
Prohibit metric reporting that relies solely on isolated p-values. Require all analytical teams to present confidence intervals covering effect sizes. Measure the downside boundary of the confidence interval against implementation cost. If the minimum plausible effect size fails to exceed operational overhead, cancel the rollout regardless of headline significance.
Governance Pitfalls and Analytical Roadblocks
Organizations attempting to scale analytical rigor encounter recurring operational hurdles. Be vigilant against these systemic points of failure:
- Incentivizing Headline Metrics over Rigor: Tying team performance bonuses to statistical lifts without requiring independent validation sets encourages silent p-hacking and selective cohort reporting.
- Conflating Machine Learning with Statistical Verification: Machine learning optimizes predictive scoring, not strategic causal explanation. Deploying complex black-box predictive models to explain customer churn drivers frequently leads to misguided interventions.
- Neglecting Data Drift in Live Environments: Real-world operational conditions are non-stationary. A statistical model calibrated during high-demand seasonal cycles degrades rapidly when macro conditions change.
Developing genuine statistical intuition for decision makers transforms analytical discussions from subjective debates into disciplined operational evaluations. By mastering data distributions, interrogating sampling biases, and demanding transparent measures of uncertainty, leaders protect their organizations from costly data missteps.
Frequently Asked Questions
What is the difference between statistical significance and practical business significance?
Statistical significance indicates whether an observed difference is unlikely to be the result of random sampling noise under a specific null hypothesis. Practical business significance evaluates whether the absolute magnitude of that effect is large enough to justify the financial, engineering, and operational costs required to implement and maintain the change.
Why are confidence intervals more informative for leaders than p-values?
A p-value provides only an index of evidence against a null hypothesis, conveying nothing about the magnitude of the impact or directional uncertainty. Confidence intervals explicitly communicate both the estimated effect size and the range of plausible real-world outcomes, allowing decision-makers to evaluate downside operational risk directly.
When should an organization choose Bayesian inference over frequentist testing?
Bayesian methods are superior when dealing with unique, non-repeatable events (such as strategic mergers or rare macro shocks), small sample sizes where prior domain knowledge must inform the model, or when stakeholders need to understand the direct probability of a hypothesis being true rather than long-run error rates under hypothetical repetitions.
How does survivorship bias manifest in modern corporate analytics?
Survivorship bias occurs when analyses focus exclusively on entities that navigated an operational gauntlet while ignoring those filtered out along the way. Common examples include analyzing top-performing enterprise customers while ignoring churned accounts, or surveying high-output employees while overlooking the practices of team members who resigned.
To identify early warning signals before algorithmic deployments fail in production, review our analysis on Why Data Science Projects Fail.
To align your data collection and validation pipeline with sound statistical design, read our analysis on data collection problems that ruin machine learning before modeling begins.
Enterprise AI Strategy & Implementation Discovery Call
Scope practical AI workflows, human-in-the-loop governance, and measurable delivery milestones with Tesseract Consulting.