
I Audited 766 Million Polymarket Trades. Here Is Why Both “Easy-Alpha” Quants and Prediction-Market Skeptics Are Wrong.
A personal reflection on our new UCL research paper, the $37 sports bet that fooled behavioral economists, why “insider trading” is a feature rather than a bug, and why my own LightGBM model lost to the crowd.
If you spend your career where I do—advising funds and founders on AI, quantitative modeling, and Web3 tokenomics—you get pitched bad ideas every single week. Over the last two years, however, one topic has dominated my inbox more than any other: Polymarket.
And almost every conversation I have falls into one of two extreme camps:
- The “Free-Money Quant” Camp: A developer or retail trader sends me a Jupyter notebook or a GitHub link. “Stelios, look at this calibration chart! Polymarket retail traders overpay by 12% for heavy favourites! I trained a gradient-boosted bot on historical prices and it returned +100% in backtesting. We’re launching a prediction-market hedge fund.”
- The “Rigged Casino” Camp: A journalist or traditional finance skeptic tells me prediction markets are useless noise. “Stelios, how does Polymarket work if a single crypto whale or someone doing Polymarket insider trading can move the odds? Isn’t the whole thing just degenerate sports gambling dressed up as probability?”
Here is my honest confession: both camps annoyed me, because both were arguing from anecdotes and cherry-picked screenshots.
So together with my co-authors Jiaqi Sun and Nikan Firoozye at the Department of Computer Science, University College London (UCL), I decided we were going to settle the debate the hard way. We didn’t sample a few dozen election markets. We pulled the entire reconstructed Polygon trade tape from the Hugging Face SII Polymarket Dataset—766,412,707 on-chain OrderFilled transactions and 1,019,069 market metadata records spanning 21 November 2022 to 4 May 2026—froze a leakage-free universe of N = 491,202 cleanly resolved markets (21 November 2022 to 30 April 2026, generating 1,401,619 backward-joined snapshots), and paired it with 1,233 full Level-2/Level-3 historical order books (Telonex Export, exported 26 June 2026).
Academic papers require neutral, diplomatic prose. This blog is my personal site, so I am going to skip the academic formalities and tell you what I actually think—and what surprised me most when our own hypotheses got humbled by the data.
“Polymarket is the purest real-world demonstration of the Grossman–Stiglitz Paradox (1980) I have ever seen in twenty-first-century finance. Where serious money is at stake, the crowd is so terrifyingly sharp that my own out-of-sample machine-learning model couldn’t beat the raw market price. And where huge statistical biases do exist, they sit inside $37 micro-markets where the bid–ask spread and fees will eat your trading bot alive.” — Dr Stylianos Kampakis
First, Let’s Clear Up a Basic Question: How Does Polymarket Work (and Why Did It Explode 1,500x)?
Before I get into my four favorite contrarian findings from our study, people outside crypto constantly ask me: “Stelios, how does Polymarket work under the hood, and how does Polymarket make money?”
Forget the blockchain jargon for a second. At its core, Polymarket is a Central Limit Order Book (CLOB) running on Polygon. Every binary question (“Will the Fed cut rates in June?”) is split into two complementary outcome tokens—YES and NO—backed by $1.00 of USDC stablecoin collateral locked in a smart contract. When the event resolves, the winning token pays $1.00 and the losing token goes to $0.00. If YES trades at $0.72 today, the market is collectively wagering that there is a 72% chance the event happens.
When I first started watching decentralized prediction markets around 2020, Polymarket was a tiny curiosity averaging 27 active markets per day. By 2026, it had exploded into a behemoth hosting over 41,000 live markets per day.
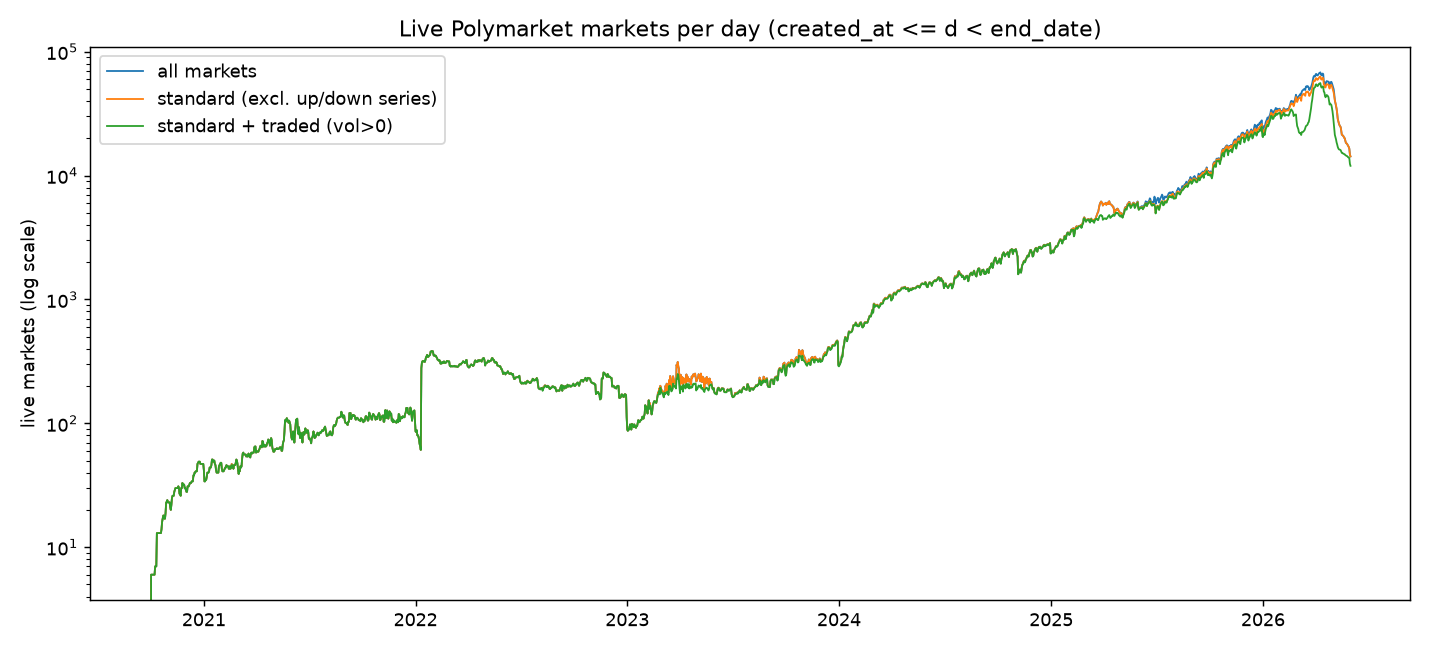
Look closely at that chart, because it explains 90% of the bad research published about prediction markets today: roughly 96% of every market in our four-year dataset was created during the 2025–2026 catalogue explosion. That created two completely different worlds living under the same roof: multi-million-dollar flagship macro/political markets, and hundreds of thousands of tiny “long-tail” contracts where almost nobody is home. If you don’t separate those two worlds, the data will lie to your face.
Contrarian Take #1The $37 Sports Bet That Fooled Behavioral Economists
When we ran our first pass over the 491,202 resolved markets at seven days before close (T-7d), counting every market equally (the standard academic practice), a massive anomaly jumped off the screen.
In traditional horse-racing and sports books, bettors overpay for longshots. On Polymarket, under equal-count weighting, we found a dramatic reverse favourite–longshot bias: longshots (p ∈ [0.05, 0.10]) won +3.4 percentage points more often than priced (95% CI: [+2.7, +4.2] pp), while heavy favourites (p ∈ [0.90, 0.95]) won -12.3 percentage points less often than priced (95% CI: [-14.6, -10.2] pp).
If I were writing a clickbait newsletter, I would have stopped right there and declared: “Crypto traders are irrational! Go short every 90–95¢ favourite on Polymarket!” In fact, if you code up a frictionless backtest on our 2025–2026 holdout that puts an equal dollar stake on every contract, fading favourites returns +25.0% and backing longshots returns +20.6%.
Except it’s a complete statistical mirage. Watch what happens when we stop counting every contract as 1 equal vote and weight by committed dollar volume:
Counting every market equally at T-7d makes 90–95% favourites look overpriced by -12.3 pp (80–90% by -6.6 pp; 70–80% by -3.4 pp; ≥95% by -1.3 pp), and gives a fake +25.0% equal-stake backtest return.
Weighting by pre-cutoff dollar volume flips 90–95% favourites to +6.3 pp (80–90% to +9.0 pp; 70–80% to +2.8 pp; 5–10% to +1.1 pp; ≥95% to +0.2 pp), and liquidity-weighted returns crash to -50.7% (fade-favourite) and -25.5% (back-longshot)!
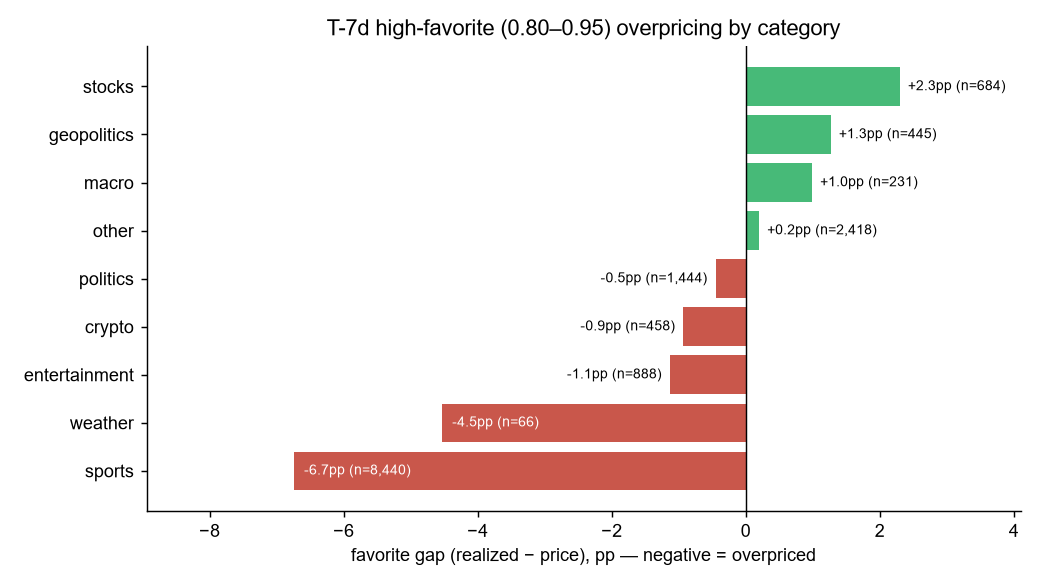
p ∈ [0.80, 0.95)) across categories. The count-weighted bias is overwhelmingly driven by sports markets (-6.90 pp gap), where the median contract had traded just $37.Contrarian Take #2Why I Tell Clients to Stop Building Price-Only “AI Trading Bots”
As someone who runs AI workshops and builds machine-learning systems for a living, I would love to tell you that a gradient-boosted tree can easily beat prediction markets. It can’t—at least not using market data alone.
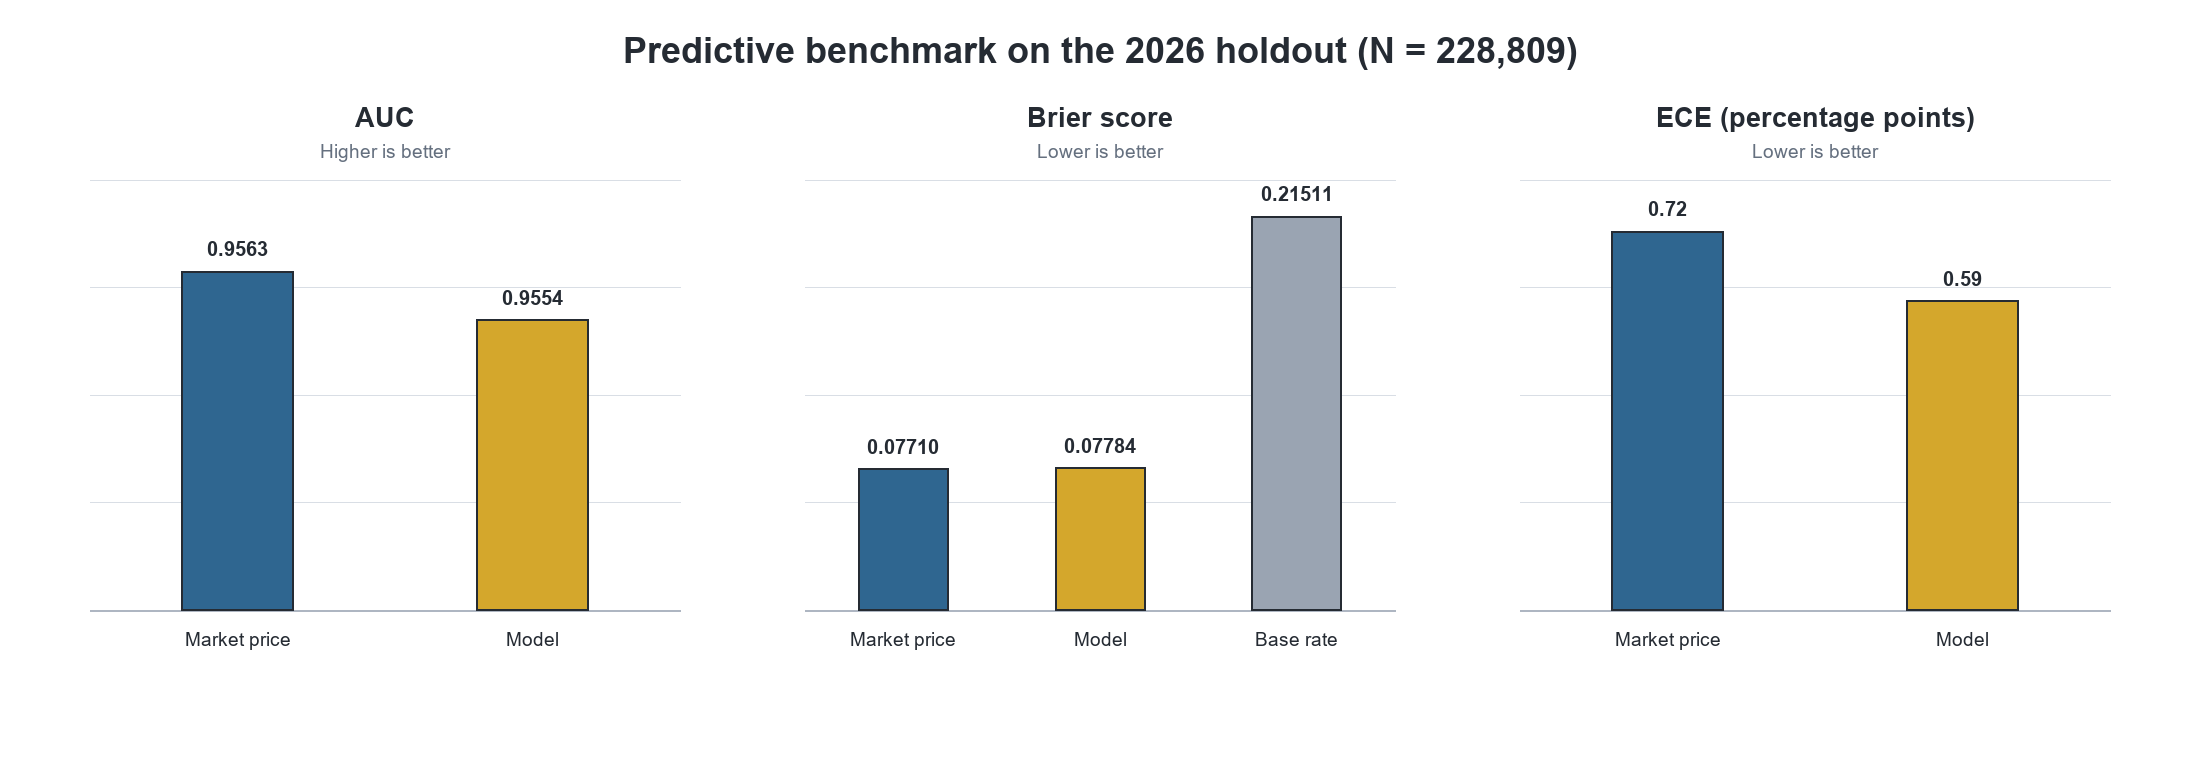
We gave machine learning the fairest, cleanest shot possible. Using strictly known-at-time features (price levels, historical momentum, trade staleness, cumulative pre-cutoff volume, and category), we trained a leakage-safe LightGBM model on all pre-2026 data and tested it out-of-sample on 228,809 holdout observations in 2026.
And what happens when you try to run automated trading bots on the order book? This brings us back to “how does Polymarket make money” and how execution costs work. Whenever you cross the order book as a taker, you pay the bid–ask half-spread plus exchange/protocol fee friction (modeled in our benchmark at a standard 2% fee assumption).
Across 1,233 historical Level-2/Level-3 order books (Telonex Export, exported 26 June 2026), every single active taker bot we tested lost heavily out-of-sample:
- Order-Book Imbalance Bot: Lost -19.3% at 25-level depth (
N = 209) and -14.6% at full-book depth (N = 203). - Wide-Spread Reversal Bot: Lost -19.7% at 25-level depth (
N = 146) and -16.1% at full-book depth (N = 140). - Thin-Book Favourite Bot (The Ultimate Overfitting Trap): During in-sample training, this strategy returned a jaw-dropping +100.0%. If I were an unscrupulous course seller, I would screenshot that +100% chart and sell a $999 Discord subscription. Out-of-sample (
N = 30at 25-level depth andN = 32at full-book depth—right at the 30-trade minimum boundary for statistical reliability), it collapsed to -50.2% and -53.4%.
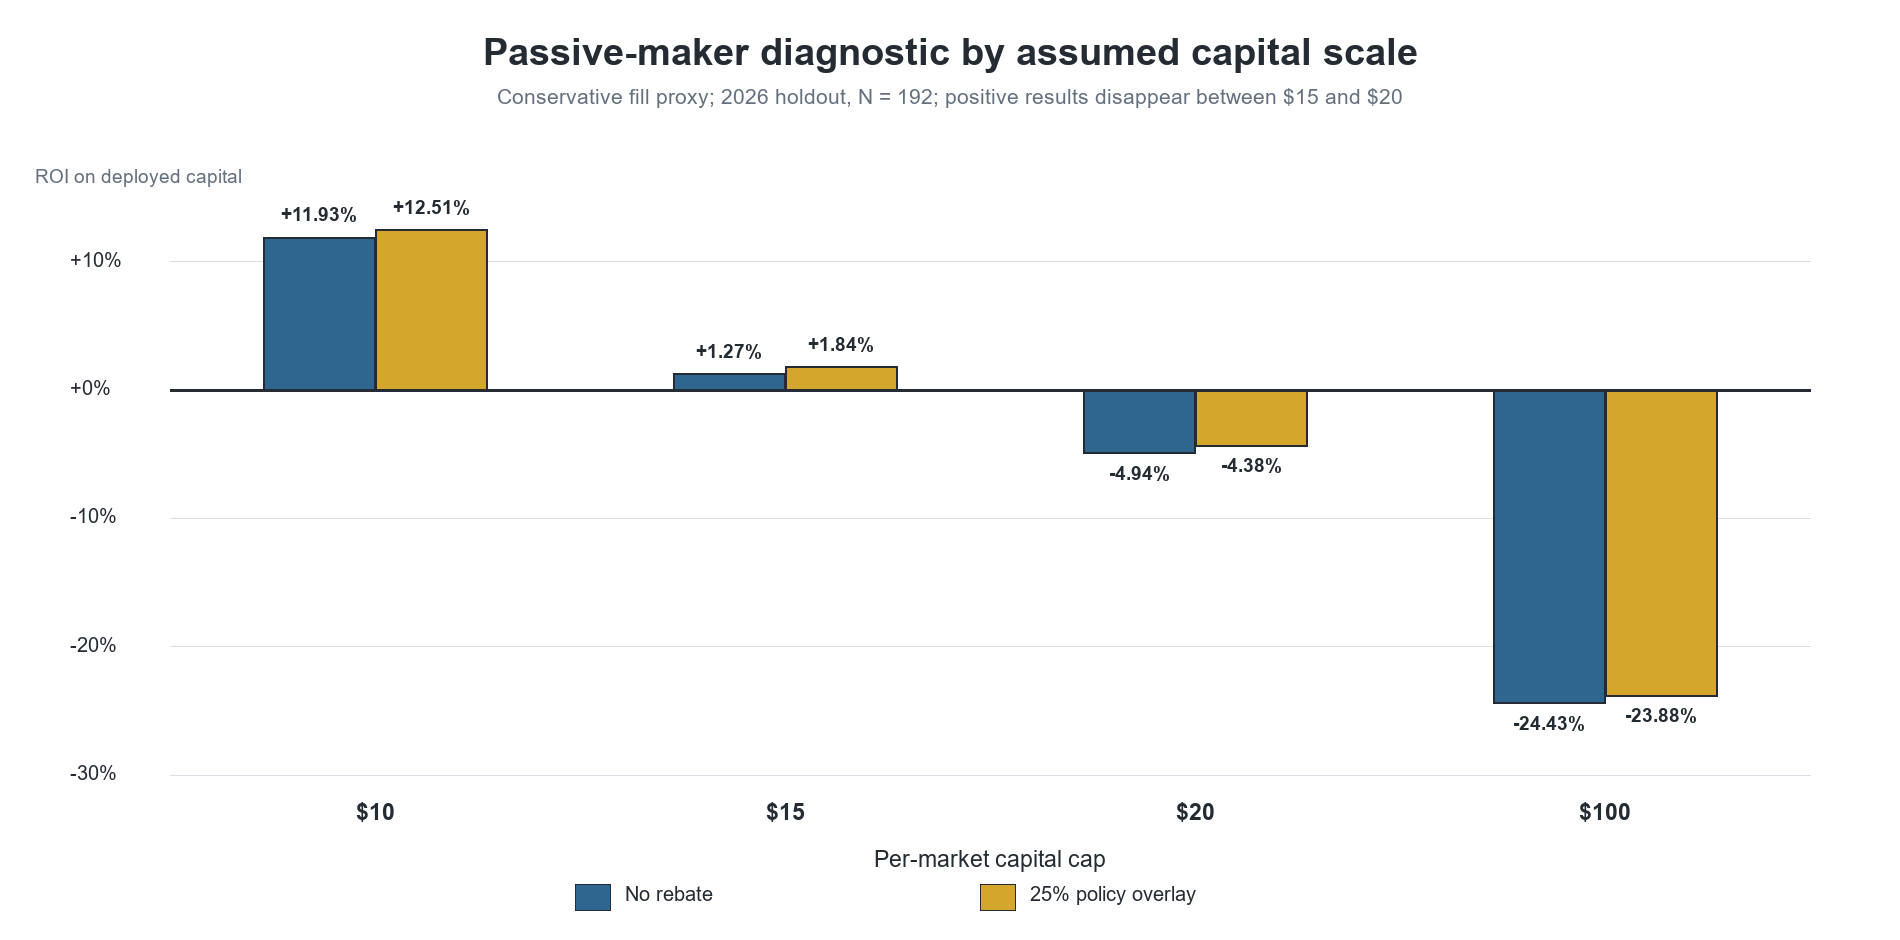
“Okay, Stelios,” quants reply, “then I’ll run a passive market-making bot and earn the spread!” In our hypothetical sensitivity analysis (using an assumed fill model with adverse-selection buffers across those 1,233 order books), passive liquidity provision ekes out +11.93% when capped at a tiny $10 per market and +1.27% at $15 per market, before plunging into losses at $20 (-4.94%) and $100 (-24.43%).
Contrarian Take #3“Polymarket Insider Trading” Is Not a Bug—It Is the Grossman–Stiglitz Engine
Every time a geopolitical event or corporate announcement happens and a Polymarket contract reprices twenty minutes before the press release hits Bloomberg, social media erupts with outrage about “Polymarket insider trading” and “unfair whales.”
Here is my unpopular opinion as an economist and data scientist: informed order flow is the entire reason prediction markets work for society.
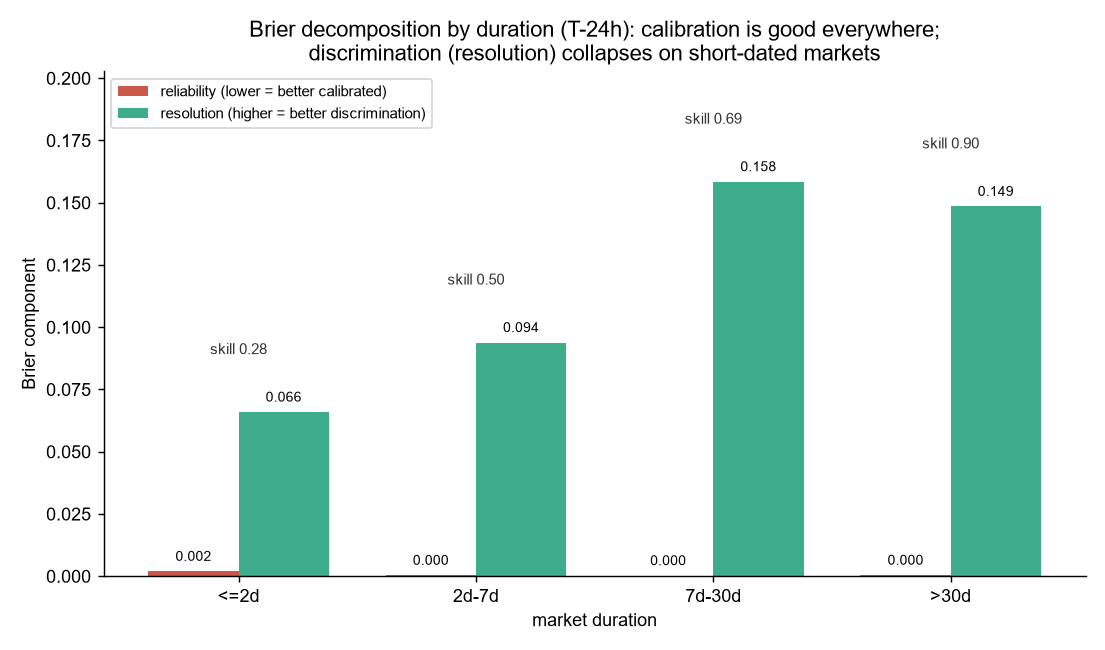
In 1980, Sanford Grossman and Joseph Stiglitz proved a foundational theorem: a market cannot be informationally efficient unless informed traders earn enough profit from less-informed participants to compensate them for the cost of acquiring information. Look at how cleanly our 491,202-market dataset validates Grossman and Stiglitz:
- Where the prize is big, whales make the market laser-accurate: Across all horizons, Polymarket’s aggregate Brier Skill Score (BSS) sits between 0.54 and 0.73. At T-24h, BSS climbs from 0.28 on short ≤2-day markets (
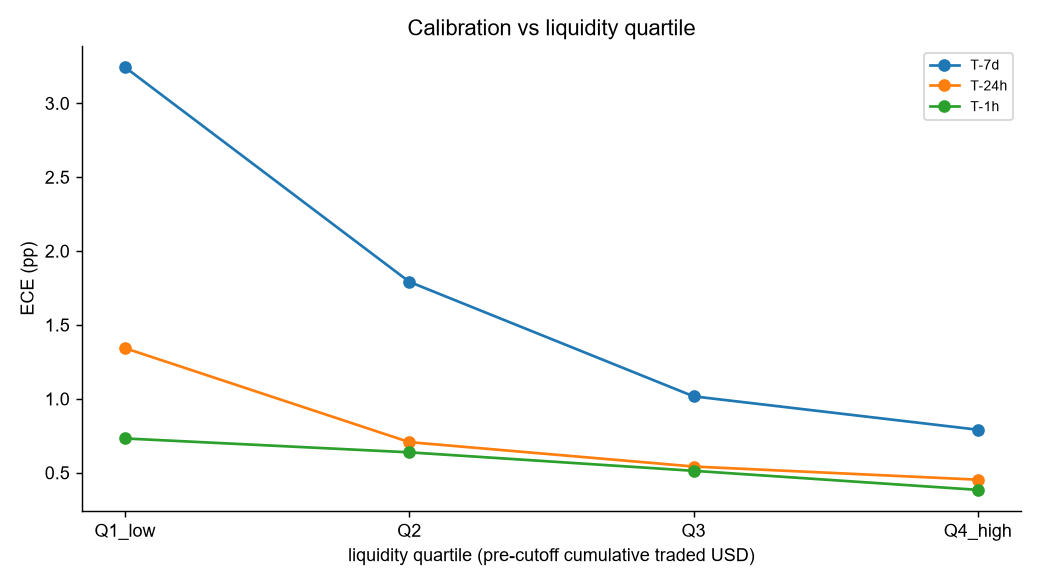
N = 129,582) and 0.50 on 2–7-day markets (N = 142,819), to 0.69 on 7–30-day markets (N = 110,424), and reaches a remarkable 0.91 on major markets lasting >30 days (N = 46,359). - Liquidity buys truth: In the top pre-cutoff volume quartile at T-7d, Expected Calibration Error (ECE) is under 1.0 percentage point. In the bottom volume quartile, ECE is over 3.0 percentage points—more than triple the error.
- Why nobody fixes the thin markets: Some people think thin markets only look miscalibrated because their last trade is weeks old. Nope. When we filtered strictly for fresh trades executed within the last 48 hours, 86% of the calibration gap between thin and thick markets survived (2.01 pp vs. 2.33 pp). Informed traders ignore thin markets because you cannot pay for serious research by trading a $37 order book with a 2% fee!
Contrarian Take #4Markets Don’t “Learn Smoothly Near the Deadline”—Your Clock Is Just Broken
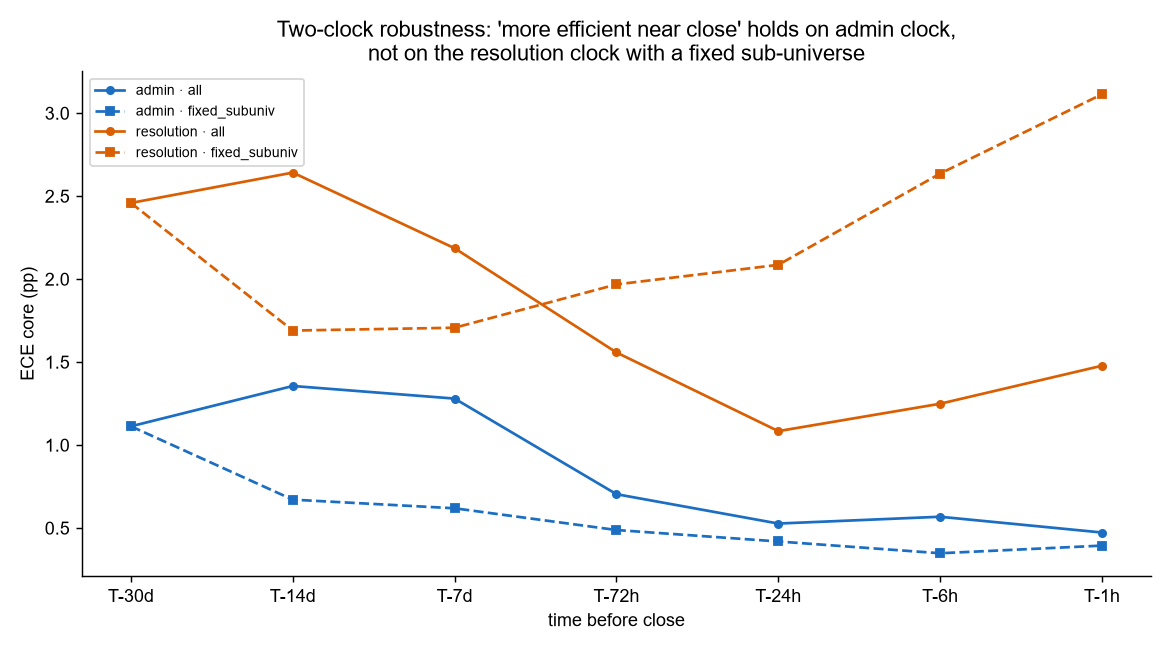
There is one last myth I want to retire. Almost every chart you see about prediction markets claims that markets “gradually learn the truth as the closing bell approaches.” And sure enough, if you measure core calibration error across a fixed panel of 20,725 markets using the official administrative close date, ECE drops smoothly from 1.11 pp at T-30d to 0.88 pp at T-7d, down to 0.39 pp at T-1h.
When Jiaqi, Nikan, and I looked closer at the timestamps, we realized something embarrassingly simple: on Polymarket, the official administrative close date often happens hours or days after the game has ended, the vote has been called, or the announcement has been made.
When we re-anchored those exact same 20,725 markets to outcome-independent information clocks, the smooth learning curve completely vanished:
- Winner-Crossing Clock (
p ≥ 0.80): Core ECE goes from 2.40 pp (T-30d) → 2.55 pp (T-7d) → 2.87 pp (T-1h). - Band-Exit Clock (permanently exits
[0.30, 0.70]): Core ECE stays flat/reverses from 2.45 pp → 2.51 pp → 2.82 pp. - Last-Material-Move Clock (final
>15 ppjump): Core ECE sharply reverses from 3.02 pp → 3.84 pp → 5.20 pp.
N = 20,725 fixed panel).My Personal Advice (Depending on Who You Are)
If you are an executive, policymaker, or investor using Polymarket as a signal: Treat high-volume Polymarket contracts as the sharpest public forecasting tool on the planet—better than polls and better than price-only AI. Never quote a thin market without checking its cumulative volume first.
If you are a quant or AI engineer trying to trade Polymarket: Stop training XGBoost or LightGBM on historical Polymarket prices and order-book imbalances hoping to find free alpha. The 2% fee assumption and bid–ask spread will bleed you dry. If you want to beat Polymarket, your edge must come from off-market, real-world information that hits your model before the whales sweep the order book.
Rapid-Fire Q&A: Questions Readers Ask Me Every Week
1. How does Polymarket work as a decentralized prediction market?
Polymarket runs a Central Limit Order Book (CLOB) on the Polygon blockchain where binary event outcomes trade as complementary YES and NO tokens between $0.00 and $1.00, backed by $1.00 of USDC collateral. When the event settles, the winning share pays $1.00 and the losing share pays $0.00, turning the market price into a live, capital-weighted probability.
2. How does Polymarket make money and why do trading bots lose?
Whenever a trader or bot crosses the order book, they face exchange/protocol fee friction (modeled in our study at a standard 2% fee assumption) plus the bid–ask half-spread paid to liquidity providers. Across 1,233 historical Level-2/Level-3 order books (Telonex Export, 26 June 2026), those real-world frictions caused every active taker strategy we tested to lose between -14.6% and -53.4% out-of-sample.
3. Does “Polymarket insider trading” ruin the market or make it more accurate?
In my view, informed whale flow is what makes liquid prediction markets work. Just as the Grossman–Stiglitz (1980) paradox predicts, informed capital enters deep markets, pushing Expected Calibration Error below 1.0 percentage point in the top volume quartile (while inflicting toxic adverse selection on passive market makers above a $15-per-market cap).
4. Why do thin Polymarket contracts look miscalibrated?
Because 96% of Polymarket’s catalogue was listed in 2025–2026, the platform has a massive tail of micro-markets (like sports favourites with a $37 median volume). In the bottom volume quartile, calibration error exceeds 3.0 percentage points (86% of which remains even when trades are fresh within 48 hours) because there isn’t enough money on the table to pay informed traders to fix the price.
5. Can an AI model beat Polymarket probabilities?
Not from market history alone. On our 228,809-observation out-of-sample holdout in 2026 (from 491,202 resolved markets and 766,412,707 trades), our leakage-safe LightGBM model scored 0.9554 AUC and 0.07784 Brier Score, losing to the raw market price (0.9563 AUC, 0.07710 Brier Score).
Level 33: Executive AI Fluency Certification
Master AI strategy, LLM deployment economics, and vendor evaluation without needing a coding background.