
I Simulated 17 Tokenised RWA Funds on Solana. Here Is Why On-Chain Yield Is Not On-Chain Liquidity.
A first-person reflection on our new 17-fund Solana RWA stock-flow study—why a 24/7 token wrapper cannot speed up a 90-day loan, why 56% Kamino looping hurts a reinsurance fund more than 95% looping hurts an auto-loan fund, and why gated private credit traps redemptions for up to 17 months.
Every cycle in crypto invents a magic phrase that supposedlyrepeals the laws of financial gravity. In 2021 it was “algorithmic stablecoins.” Over the past eighteen months, sitting in tokenomics advisory calls with hedge funds, DeFi treasuries, and asset managers, the new magic phrase in my inbox has been Tokenised Real-World Assets (RWAs).
And almost every pitch I hear from founders or yield farmers relies on the exact same sleight of hand:
- The “Instant Blockchain Liquidity” Pitch: “Stelios, we put private credit, trade finance, or reinsurance onto Solana! Because it’s an SPL token trading 24/7 and accepted as collateral on Kamino and Loopscale, investors get 10% to 13.6% real-world yield with instant on-chain liquidity!”
- The “Loop It to 30% APY” Pitch: “Stelios, why settle for 4% in Treasury bills when we can post an RWA token on Kamino Lend, borrow stablecoins against it, re-buy the same RWA token four times over, and farm leveraged real-world yield with zero crypto volatility?”
Here is my blunt answer after a decade of auditing token economies: wrapping a slow-settling loan in a fast-moving token changes how the share certificate moves, not how fast the underlying cash arrives.
Together with my co-author Linas Stankevičius at TokenLab Quantitative Research and The Tesseract Academy, I decided to replace marketing decks with an accrual-basis stock-flow simulation built directly from on-chain state. On 28 October 2026 (2026-10-28), we queried a public Solana RPC endpoint to decode every lending reserve on Kamino Lend and every loan account on Loopscale. We extracted every RWA token those venues actually accept, measured the exact share of each fund’s total AUM posted as looped collateral on-chain, and added major Treasury-bill funds (BUIDL, USDY, USTB, wYLDS) and evergreen private credit (HLSCOPE) as benchmarks.
That gave us 17 real-world-asset funds spanning US and Mexican Treasury bills, HELOCs, near-prime auto loans, Brazilian credit-card receivables, payments credit, trade finance, GPU-backed loans, property-and-casualty reinsurance, private credit, secured institutional lending, and crypto cash-and-carry. Using our open-source TokenisedProductEconomy engine in TokenLab, we simulated every fund over 36 monthly steps across 9 market regimes (including a 30% institutional run, a settlement freeze, a combined credit crisis, and an on-chain looping unwind), running 100 Monte Carlo paths per scenario and 20,000 Dirichlet weight and scale perturbation draws.
“Putting a private-credit or reinsurance fund on Solana is like bolting a Ferrari speedometer onto a container ship. The dashboard updates in milliseconds, and DeFi money markets will happily let you lever up the bill of lading—right up until everyone rushes for the lifeboats and discovers the cargo still takes three months to unload.” — Dr Stylianos Kampakis
Explore our live Liquidity Stress-Test Results across 32 RWA tokens and DeFi yield vaults on Ethereum, Solana, Base, and Arbitrum (with tokenised US T-Bills pinned as the Risk-Free Reference)—or use the Custom Vault Simulator to stress-test any vault structure in your browser:
First, What Happens When You Put All 17 Funds Through the Same 9 Stress Tests?
Before I dive into my four favorite contrarian takeaways, look at the big picture across our 17-fund universe. We scored every simulated path from 0 to 100 across four strict investor pillars—excess return over the 3.96% Treasury-bill rate (30% weight), exit speed and immediate-exit cost (30% weight), capital stability / drawdown resistance (20% weight), and same-period liquidity resilience (20% weight). Crucially, we scored sponsor profitability separately, so a fund can never look better to investors just by charging higher management fees.
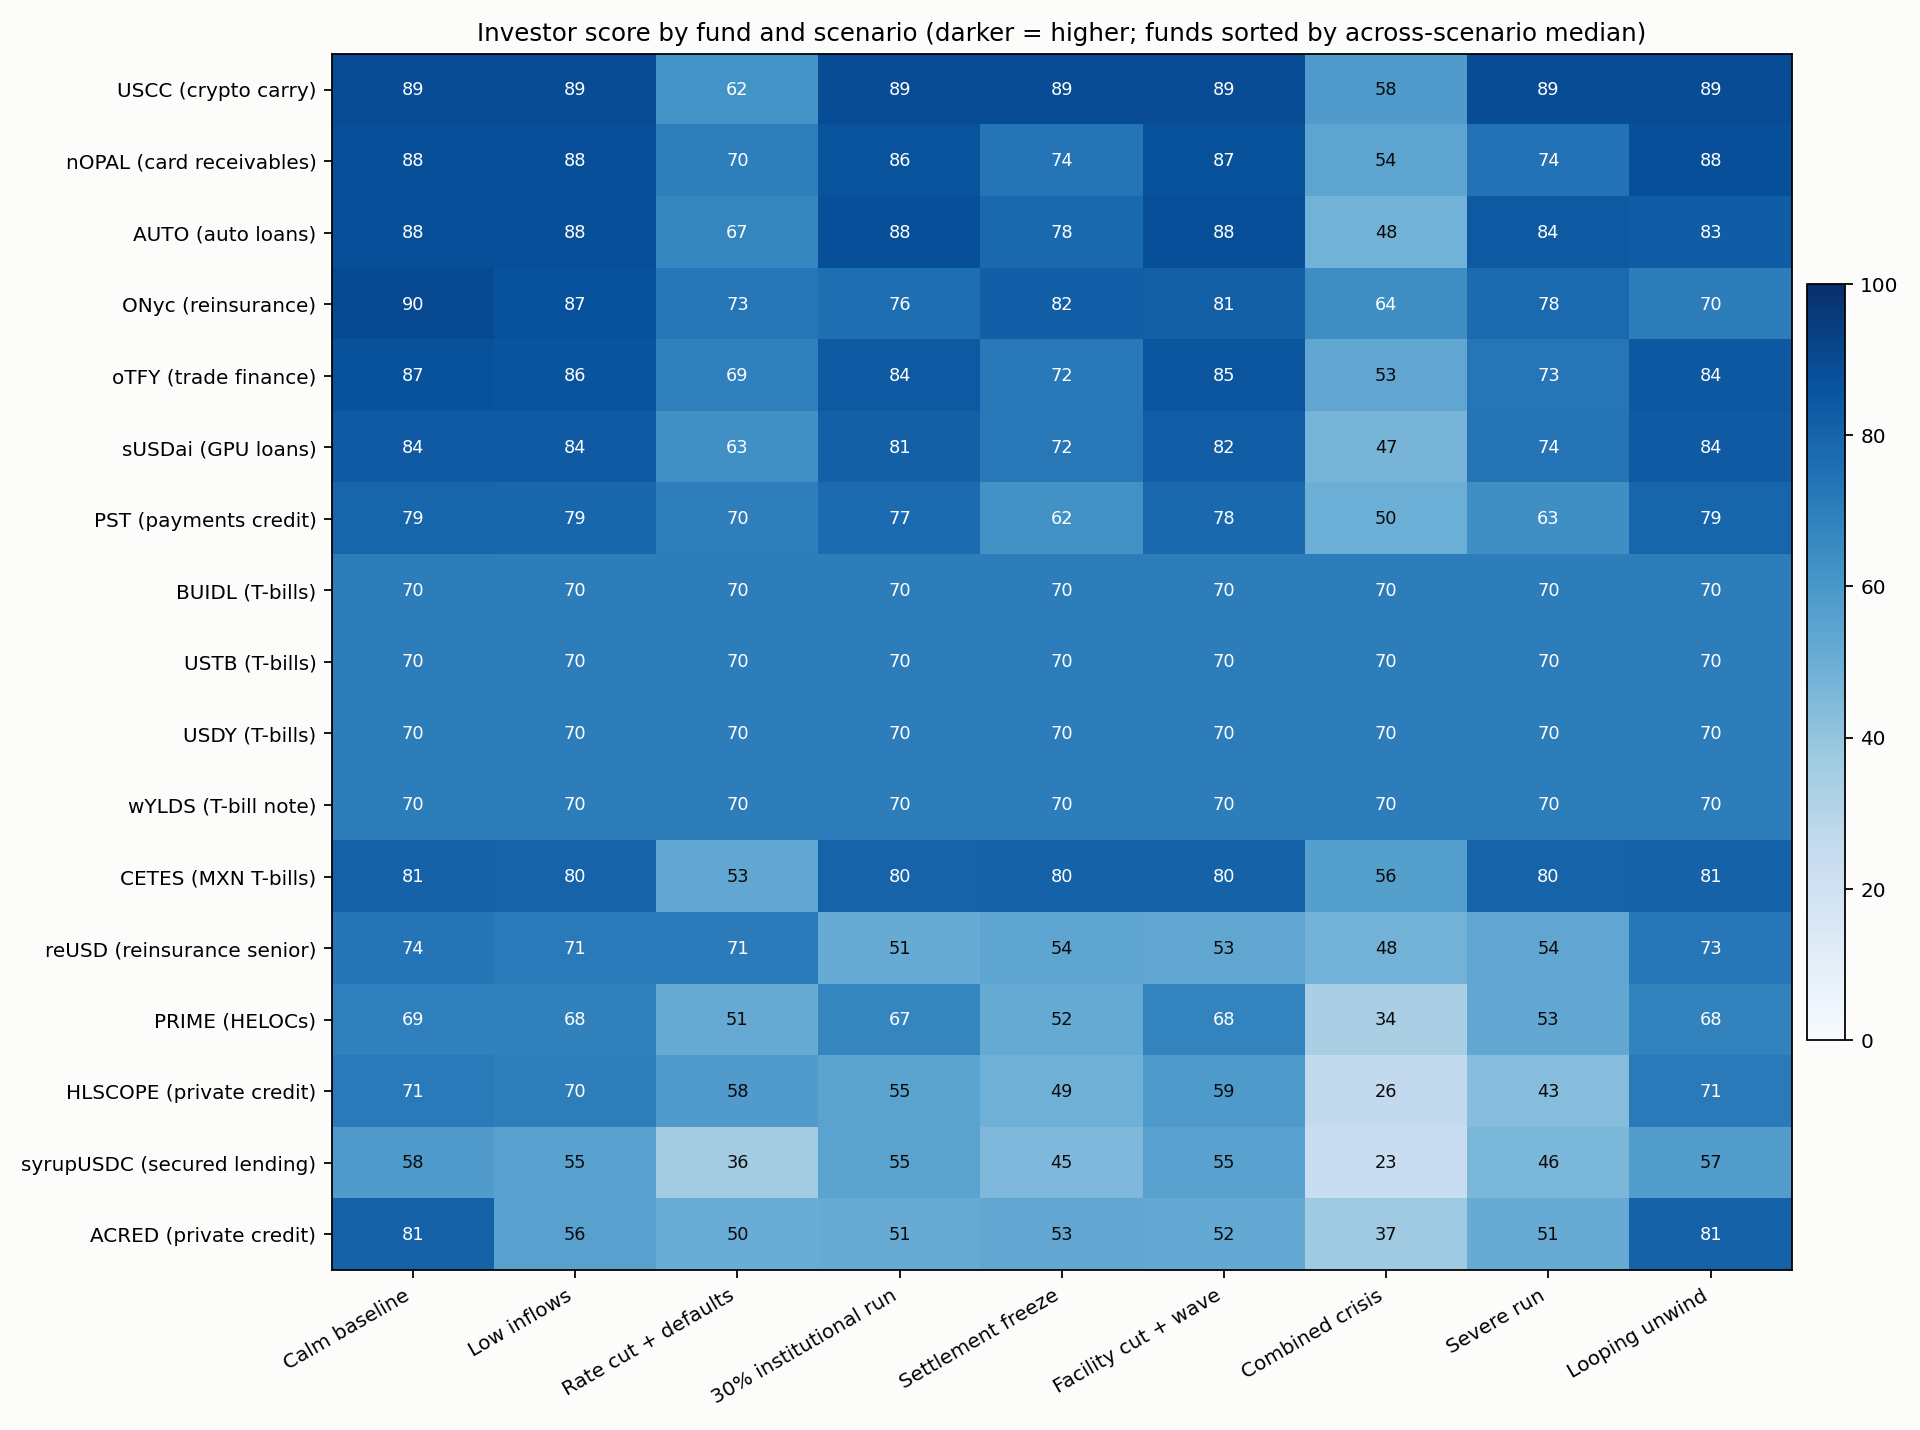
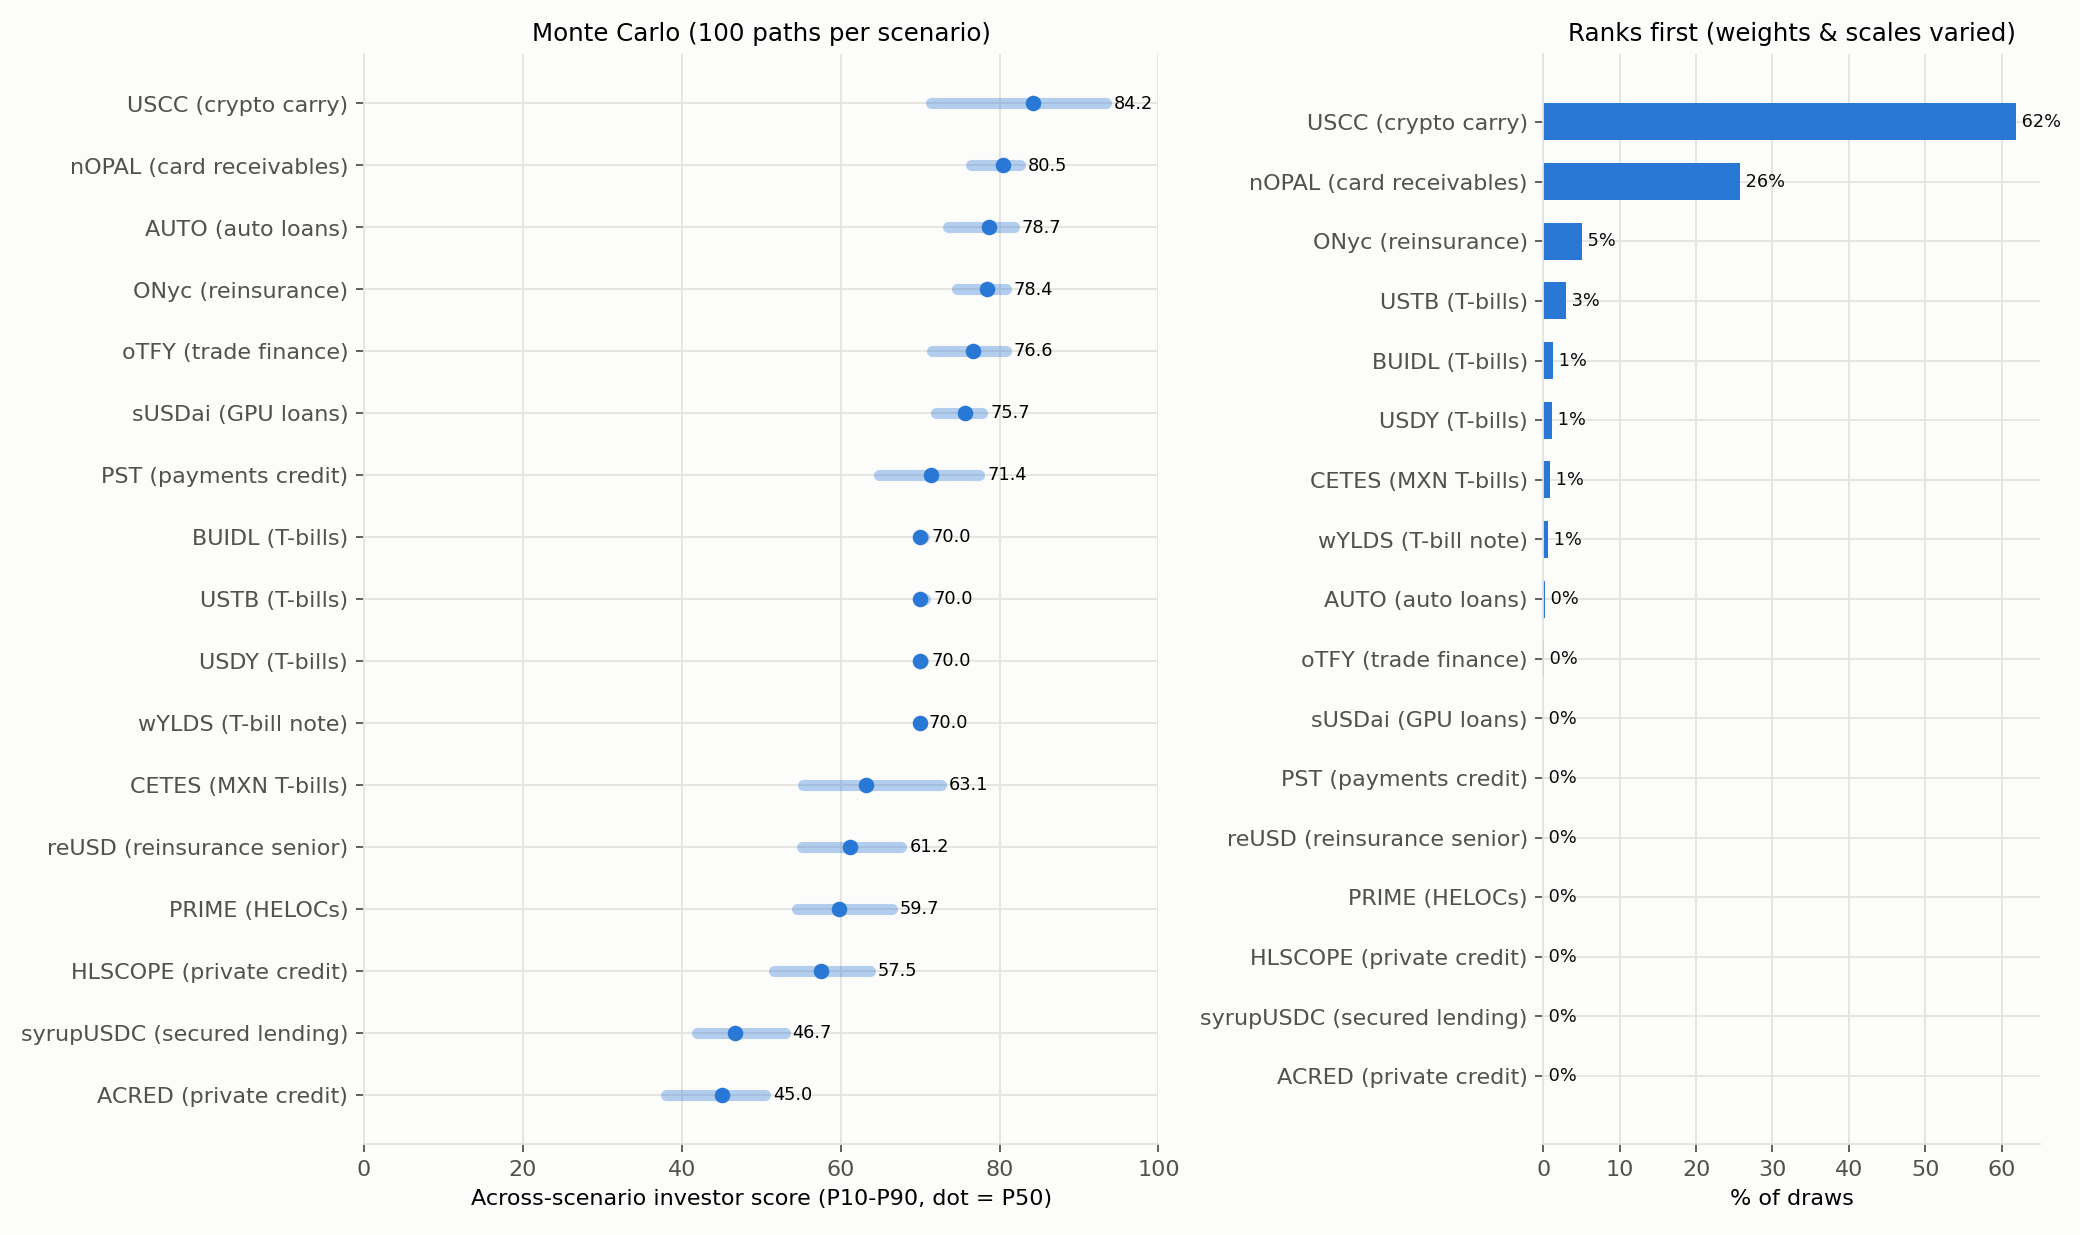
Look at how the universe splits into three distinct structural tribes in Figure 1:
- The High-Yield Short-Lag Leaders: USCC (crypto carry) takes the #1 overall spot (across-scenario median score 84.2, ranking first in 62% of perturbed weight/scale draws and 70% at published weights), followed by nOPAL (Brazilian card receivables, 80.5), AUTO (near-prime auto loans, 78.7), ONyc (reinsurance, 78.4), oTFY (trade finance, 76.6), sUSDai (GPU loans, 75.7), and PST (payments credit, 71.4).
- The 70.0 Treasury-Bill Anchor: All four US Treasury-bill products—BlackRock BUIDL, Superstate USTB, Ondo USDY, and wYLDS—score an unshakeable 70.0 in every single scenario. They earn roughly the 3.96% risk-free rate minus fees (so their excess-yield pillar is 0), but they score 100/100 on exit, stability, and ready liquidity even in a severe crisis.
- The Gated / Slow-Asset Lagging Tail: Once you add currency volatility (CETES at 63.1), 3-month senior reinsurance lag (reUSD at 61.2), lower-yielding HELOCs (PRIME at 59.7), zero idle cash buffer (syrupUSDC at 46.7), or binding monthly redemption gates (HLSCOPE at 57.5 with a 5.0%/mo gate; ACRED at 45.0 with a 1.7%/mo gate), stress scenarios punish exit liquidity severely.
Contrarian Take #1The 17-Month Exit Queue: Why “24/7 Token Transfers” Don’t Save Gated Private Credit in a Run
In calm baseline markets, gated private credit looks fantastic. ACRED (Apollo diversified private credit, 8.50% gross yield) scores 81 in the calm baseline—beating every Treasury-bill fund by 11 points. HLSCOPE (Hamilton Lane SCOPE feeder, 6.58% gross yield) scores 71 in calm markets.
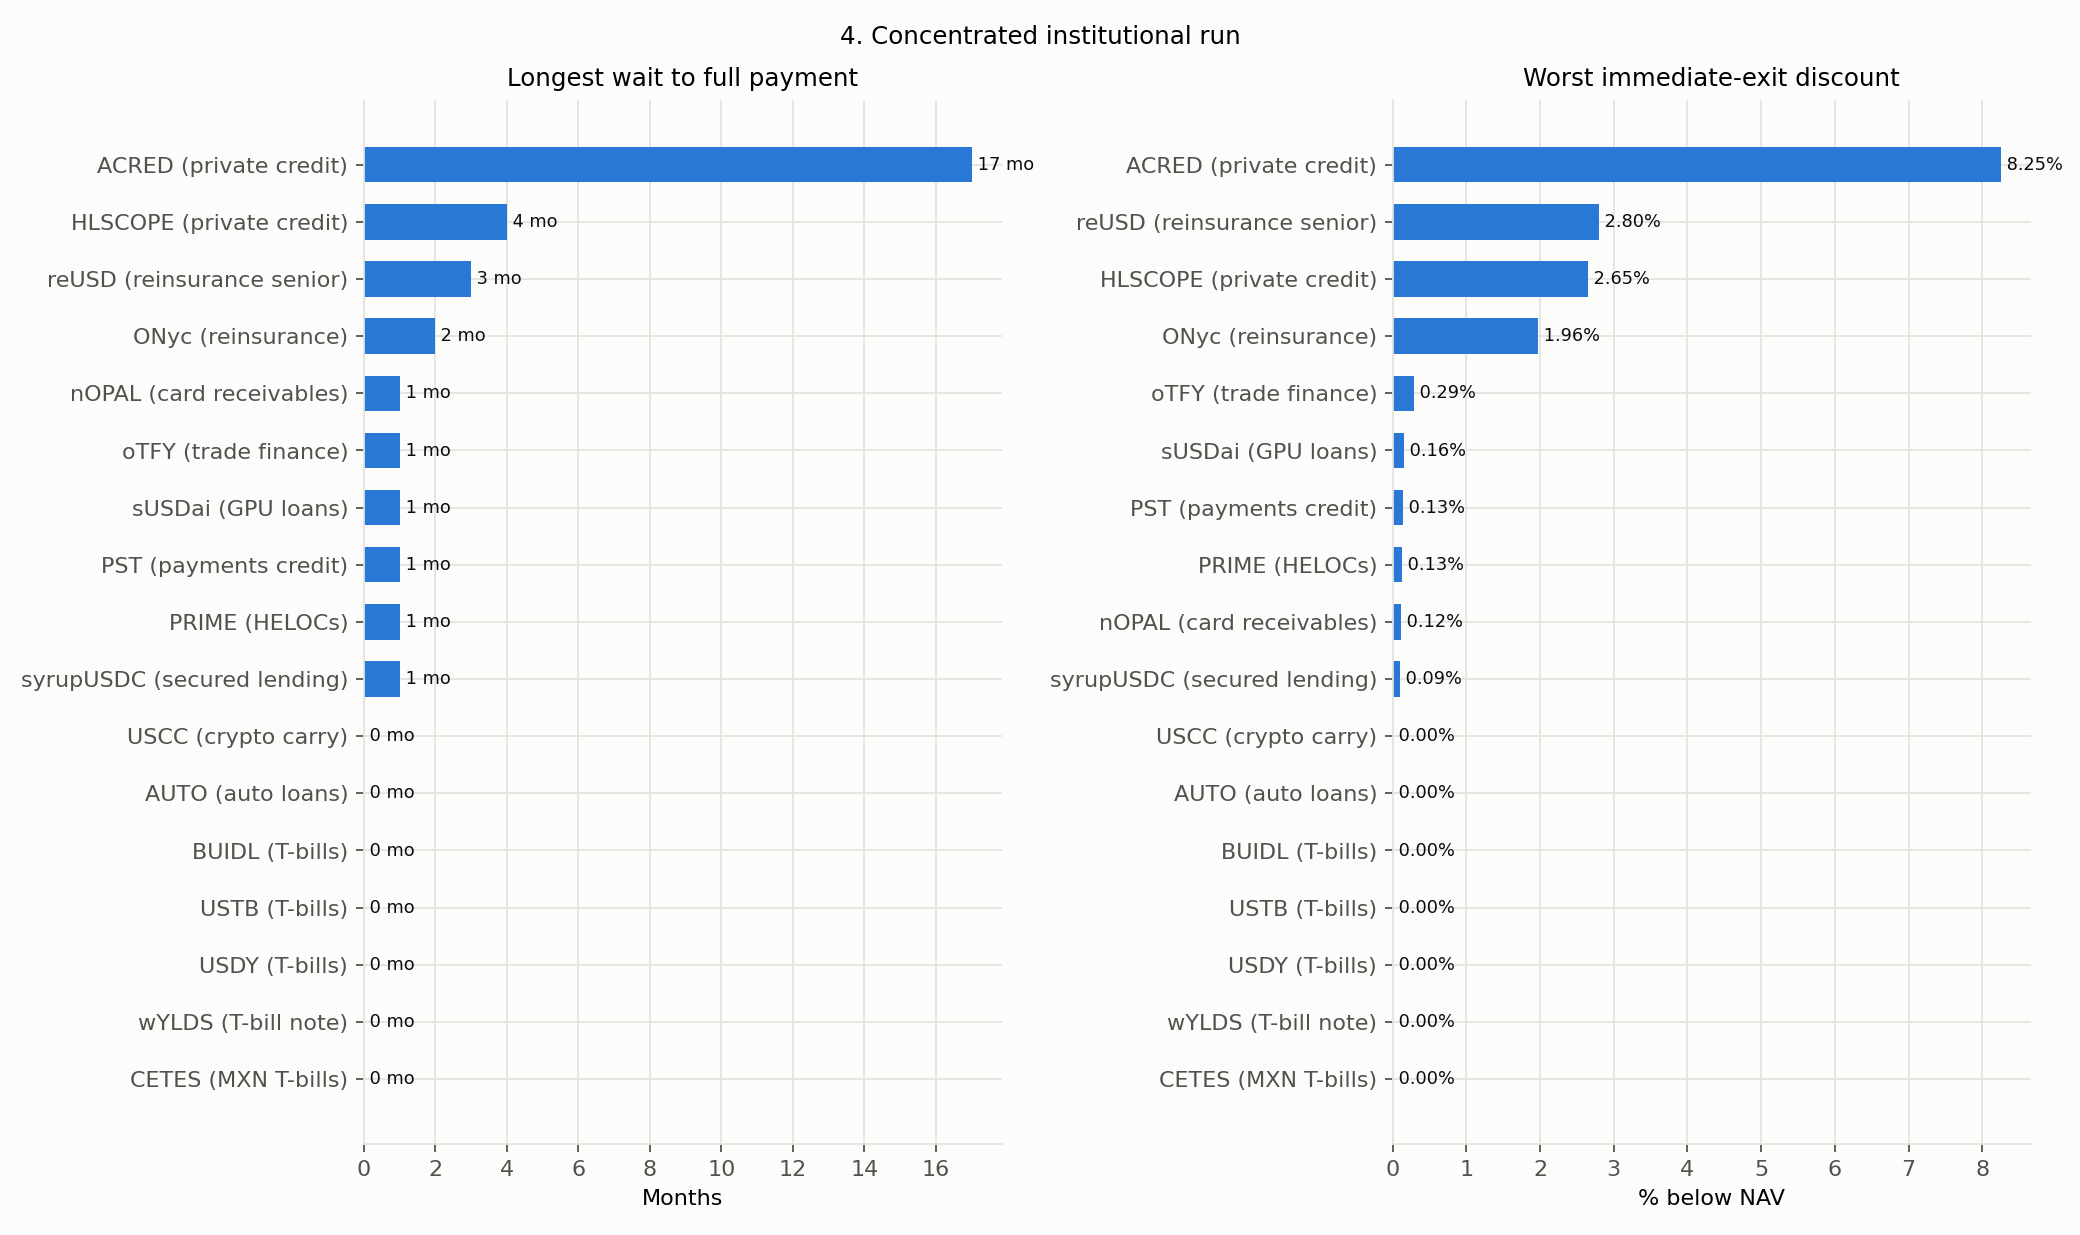
Then we trigger Scenario 4: a 30% institutional redemption run in Month 12, modelled after classic open-end fund fragility (Diamond & Dybvig, 1983; Goldstein et al., 2017).
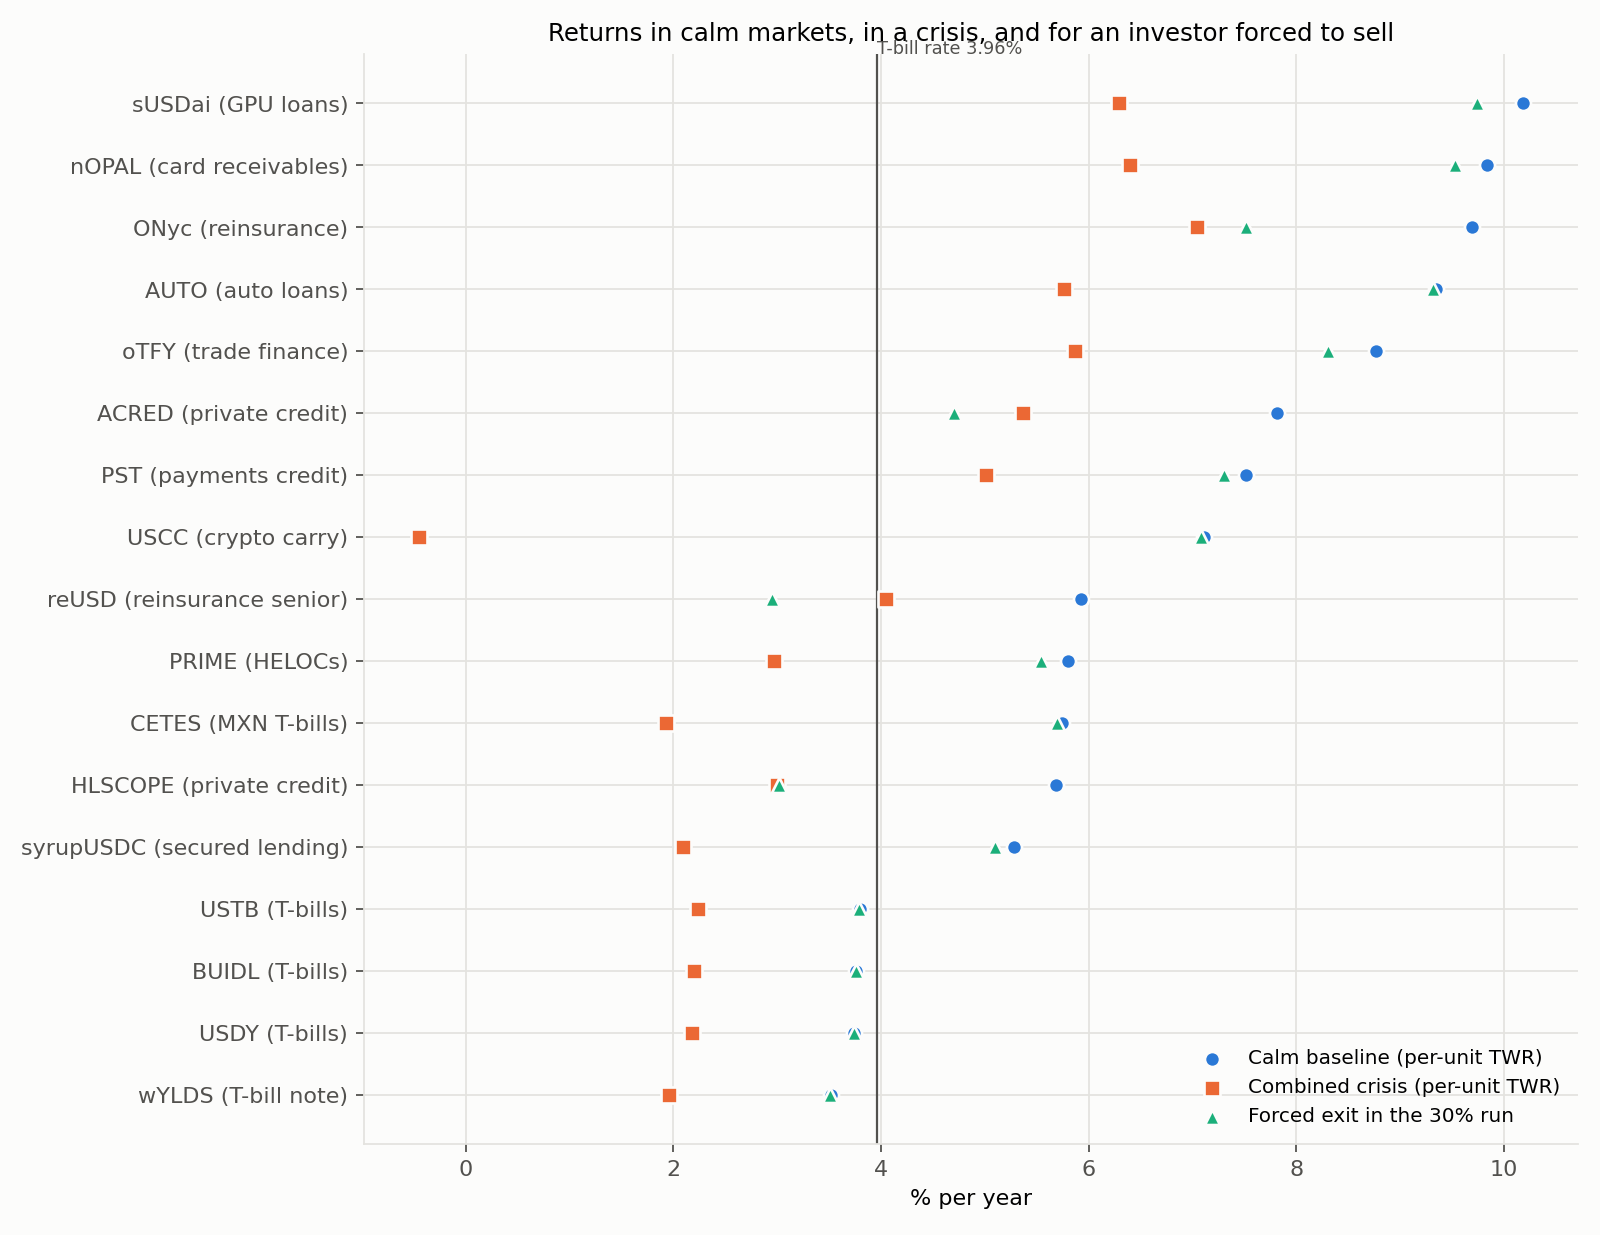
In calm markets with steady inflows, ACRED (80.7 / 81 rounded) and HLSCOPE (71.3) pay 7.82% and 5.69% net TWR with 0.00 months wait and 0.00% exit discount.
Under a 30% run, ACRED’s 1.7%/mo gate locks redeeming holders in a FIFO queue for up to 17 months (avg 7.43 mo, 8.25% immediate-exit discount). HLSCOPE’s 5.0%/mo gate causes a 4-month max wait (2.65% discount).
Contrarian Take #2The Kamino Looping Paradox: Why 56% Looped Reinsurance Crashes Harder Than 95% Looped Auto Loans
This was my favorite empirical discovery from reading the Solana blockchain directly. When Linas and I decoded every reserve on Kamino Lend and every loan on Loopscale as of 2026-10-28, we calculated the exact percentage of each fund’s total AUM locked as lending collateral (“looped”):
- AUTO (near-prime auto loans, $103.0M AUM): An astonishing 95% of its entire AUM is posted as collateral on Kamino.
- ONyc (property & casualty reinsurance, $301.0M AUM): 56% of its AUM is looped on Kamino.
- oTFY (trade finance, $29.7M AUM): 24% looped.
- PRIME (HELOCs, $579.0M AUM): 15% looped.
- nOPAL ($117.0M), PST ($400.0M), syrupUSDC ($958.8M), reUSD ($364.0M): 8%, 7%, 6%, and 3% looped respectively.
If you asked 100 DeFi risk managers which token would suffer more when leveraged loopers are forced to unwind—a fund that is 95% looped (AUTO) or a fund that is 56% looped (ONyc)—99 of them would say AUTO.
And 99 of them would be wrong. Watch what happens in Scenario 9 (Looping Unwind), where looped holders unwind 60% of their position in Month 12 and 20% in Month 13 while everything else stays in calm baseline conditions:
Despite having 95% of AUM looped on Kamino, AUTO’s underlying auto-loan cash flows settle within 1 month. Max wait is 1 month (avg 0.43 mo) and peak exit discount is just 0.57%.
With 56% of AUM looped against reinsurance assets that take 3 months to liquidate, ONyc builds a 3-month queue (avg 0.79 mo), a 2.64% exit discount, and loses 19.5 points.
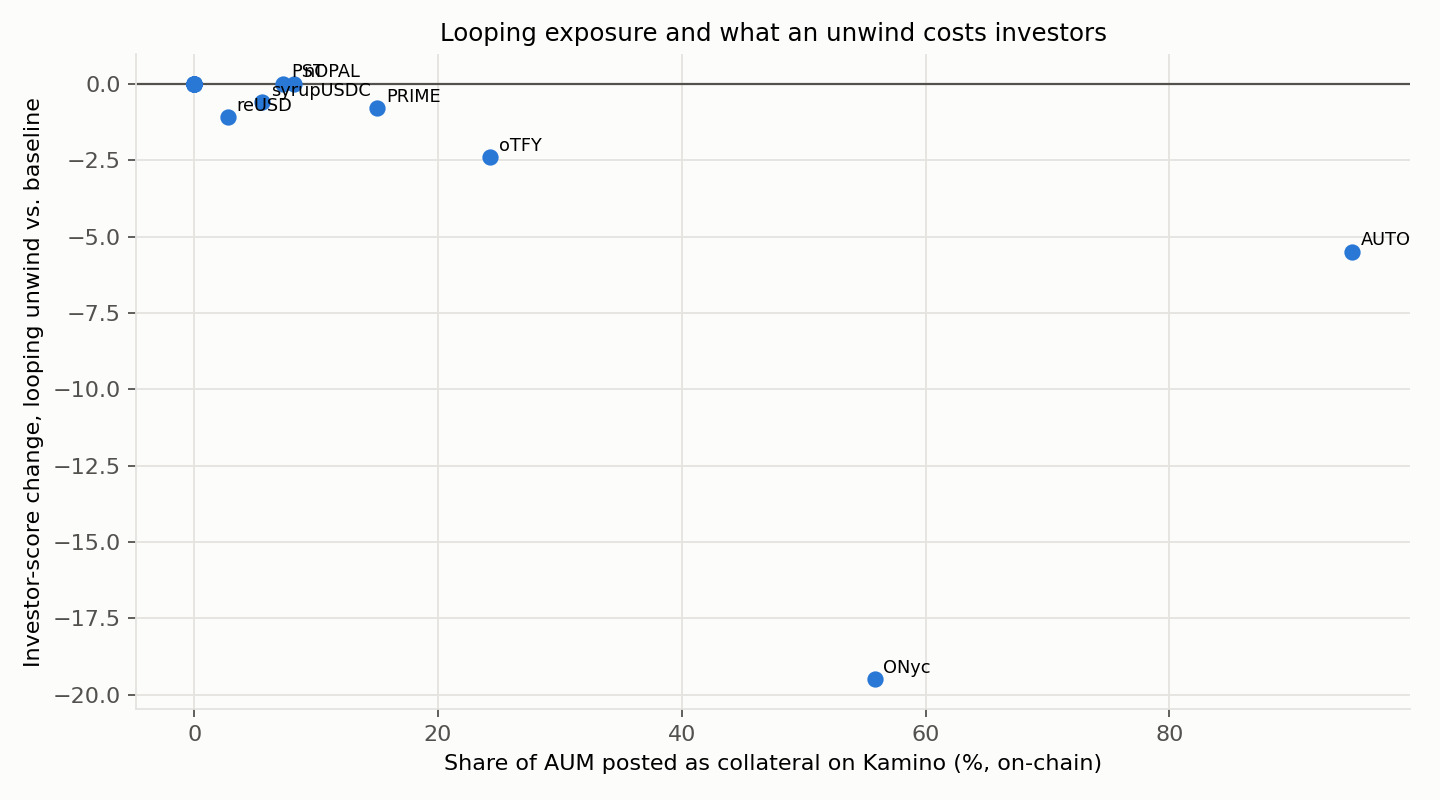
And notice our explicit model boundary: our stock-flow engine models primary redemption queues and no-arbitrage secondary discounts, not atomic liquidation cascades through thin Solana DEX pools. That means a -19.5 point drop for ONyc is a conservative lower bound on what happens if Kamino liquidators dump collateral into an illiquid Orca or Raydium pool.
Contrarian Take #312 of 13 Risky RWA Funds “Pay Enough”—Until You Look Under the Hood of Credit-Loss Assumptions
A composite ranking tells you whether Fund A beats Fund B, but it doesn’t answer the fundamental question every allocator asks me: “Stelios, does the extra yield over 3.96% Treasury bills actually pay me enough for the illiquidity and volatility?”
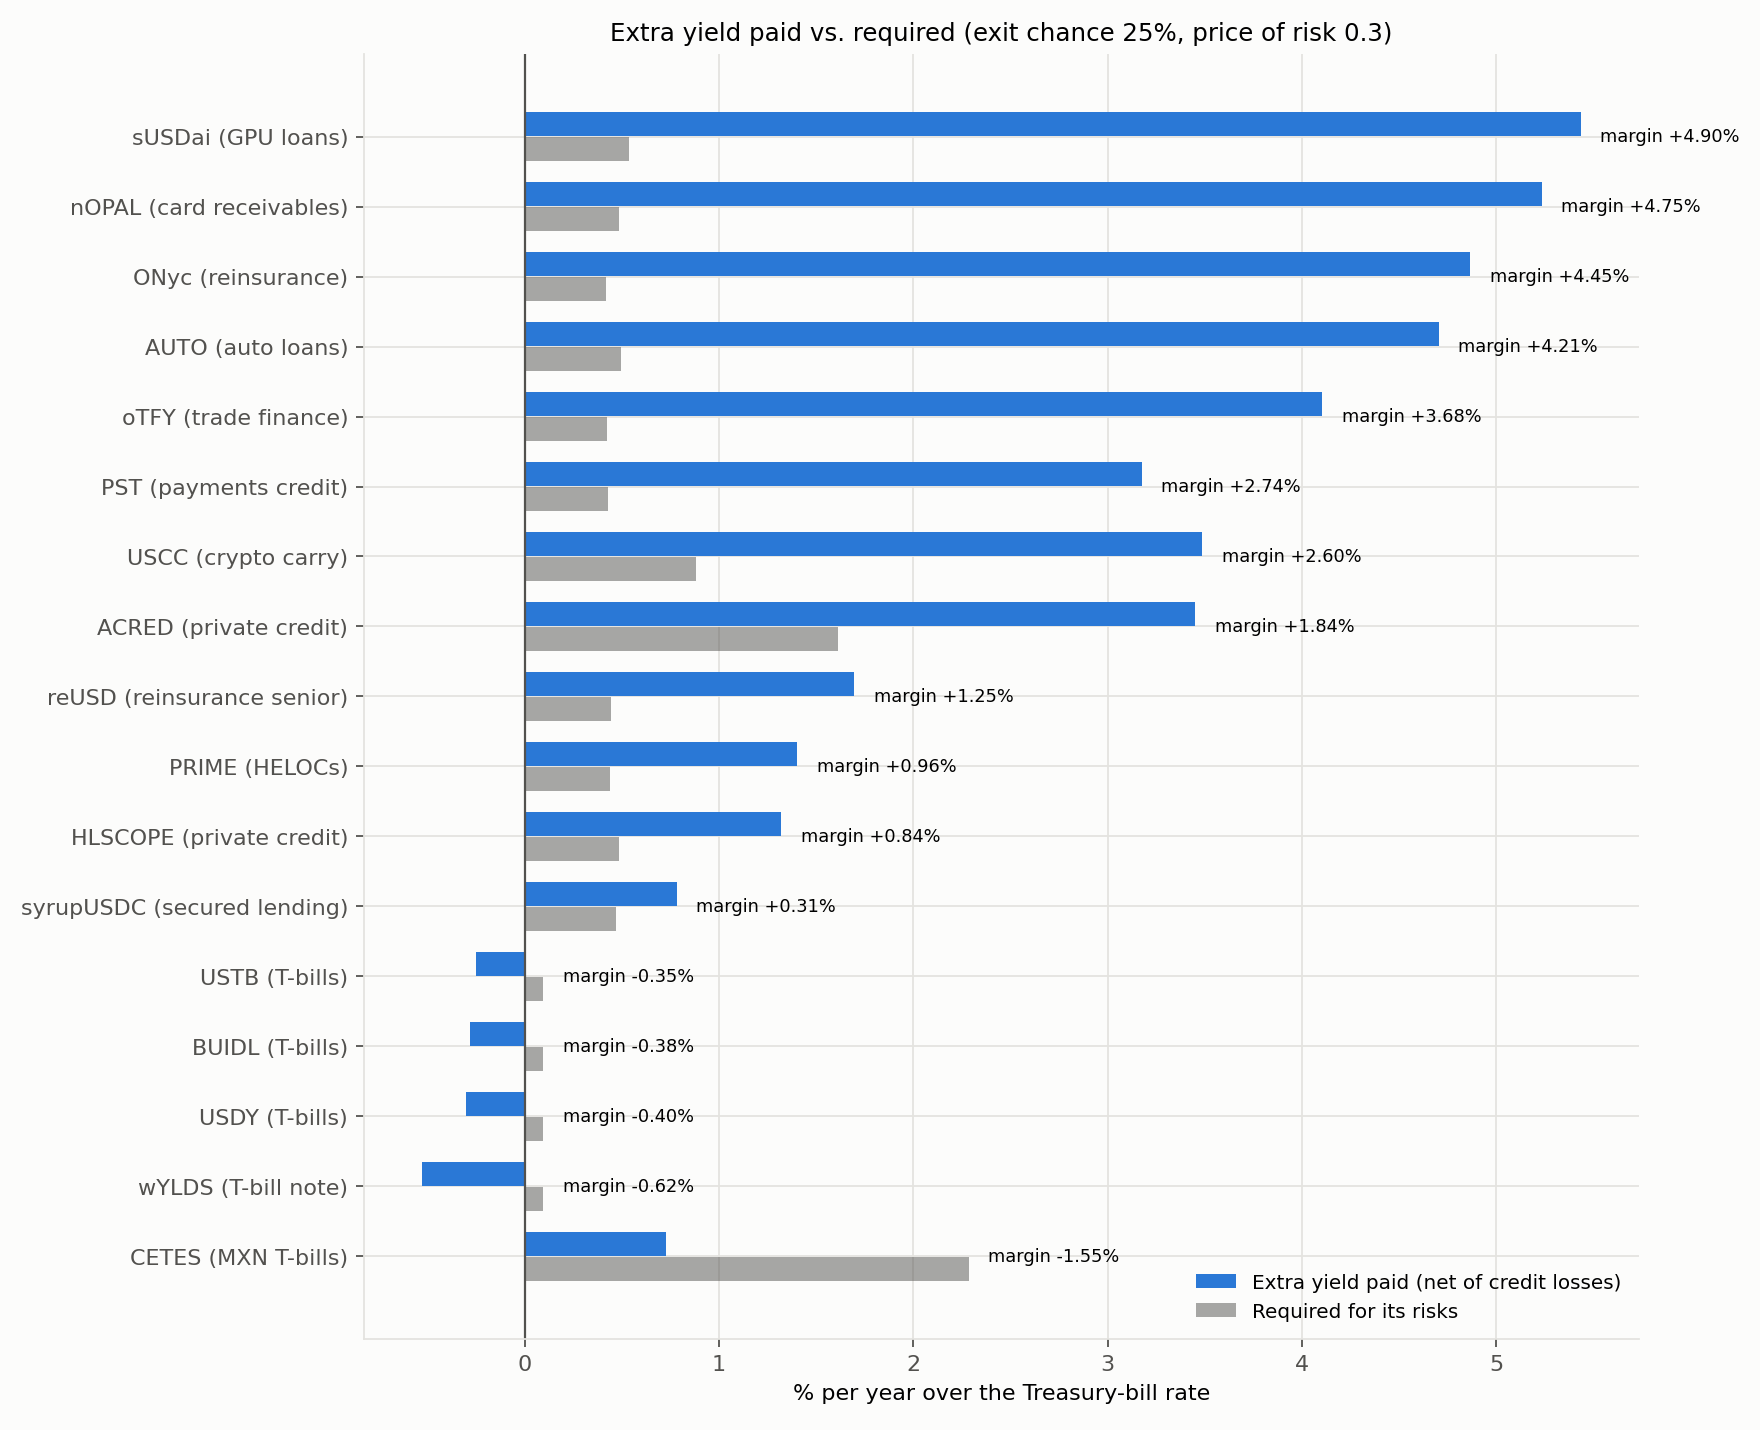
So we priced those risks directly. Across all 900 simulated paths per fund (9 scenarios × 100 Monte Carlo repetitions), we measured the expected excess return net of credit write-downs (spread paid) and compared it against the required spread:
s_req = q × (forced-exit cost) + λ × (excess-return volatility)
In our central case—where an investor faces a q = 25% chance of being forced to sell at the worst secondary discount over a 3-year holding period and demands a Sharpe-style price of risk λ = 0.3—12 of the 13 higher-yielding funds pay enough:
- The Big Positive Margins: sUSDai (GPU loans) clears by +4.90%/yr (5.44% paid vs 0.54% required), nOPAL (card receivables) by +4.75%/yr (5.23% paid vs 0.49% required), ONyc (reinsurance) by +4.45%/yr (4.87% paid vs 0.42% required), AUTO (auto loans) by +4.21%/yr (4.70% paid vs 0.49% required), oTFY (trade finance) by +3.68%/yr, PST (payments credit) by +2.74%/yr, and USCC (crypto carry) by +2.60%/yr. Even ACRED (+1.84%/yr), reUSD (+1.25%/yr), PRIME (+0.96%/yr), HLSCOPE (+0.84%/yr), and syrupUSDC (+0.31%/yr) clear the hurdle in the central case.
- The Uncompensated Risk Trap — CETES (MXN T-bills): The tokenised Mexican government T-bill fund pays only +0.73%/yr excess return over USD T-bills after scenario shocks, while exposing USD investors to 7.61% annualised peso FX volatility (worst-decile excess return -11.83%). It requires 2.28%/yr and fails by -1.55%/yr across every single cell of our sensitivity grid (from -0.79% to -3.08%).
Contrarian Take #4What Smaller Issuers Don’t Disclose Can Hurt You—And Why Sponsor Break-Even Matters
When we audited the public documentation for all 17 funds on issuer portals, SEC filings, and rwa.xyz, we refused to sweep missing parameters under the rug. Every single parameter we could not verify from a dated public document was flagged as an assumption (from 6/21 flagged parameters on syrupUSDC and 7/22 on BUIDL, up to 15/21 on ACRED and sUSDai) and swept one-at-a-time across wide ranges.
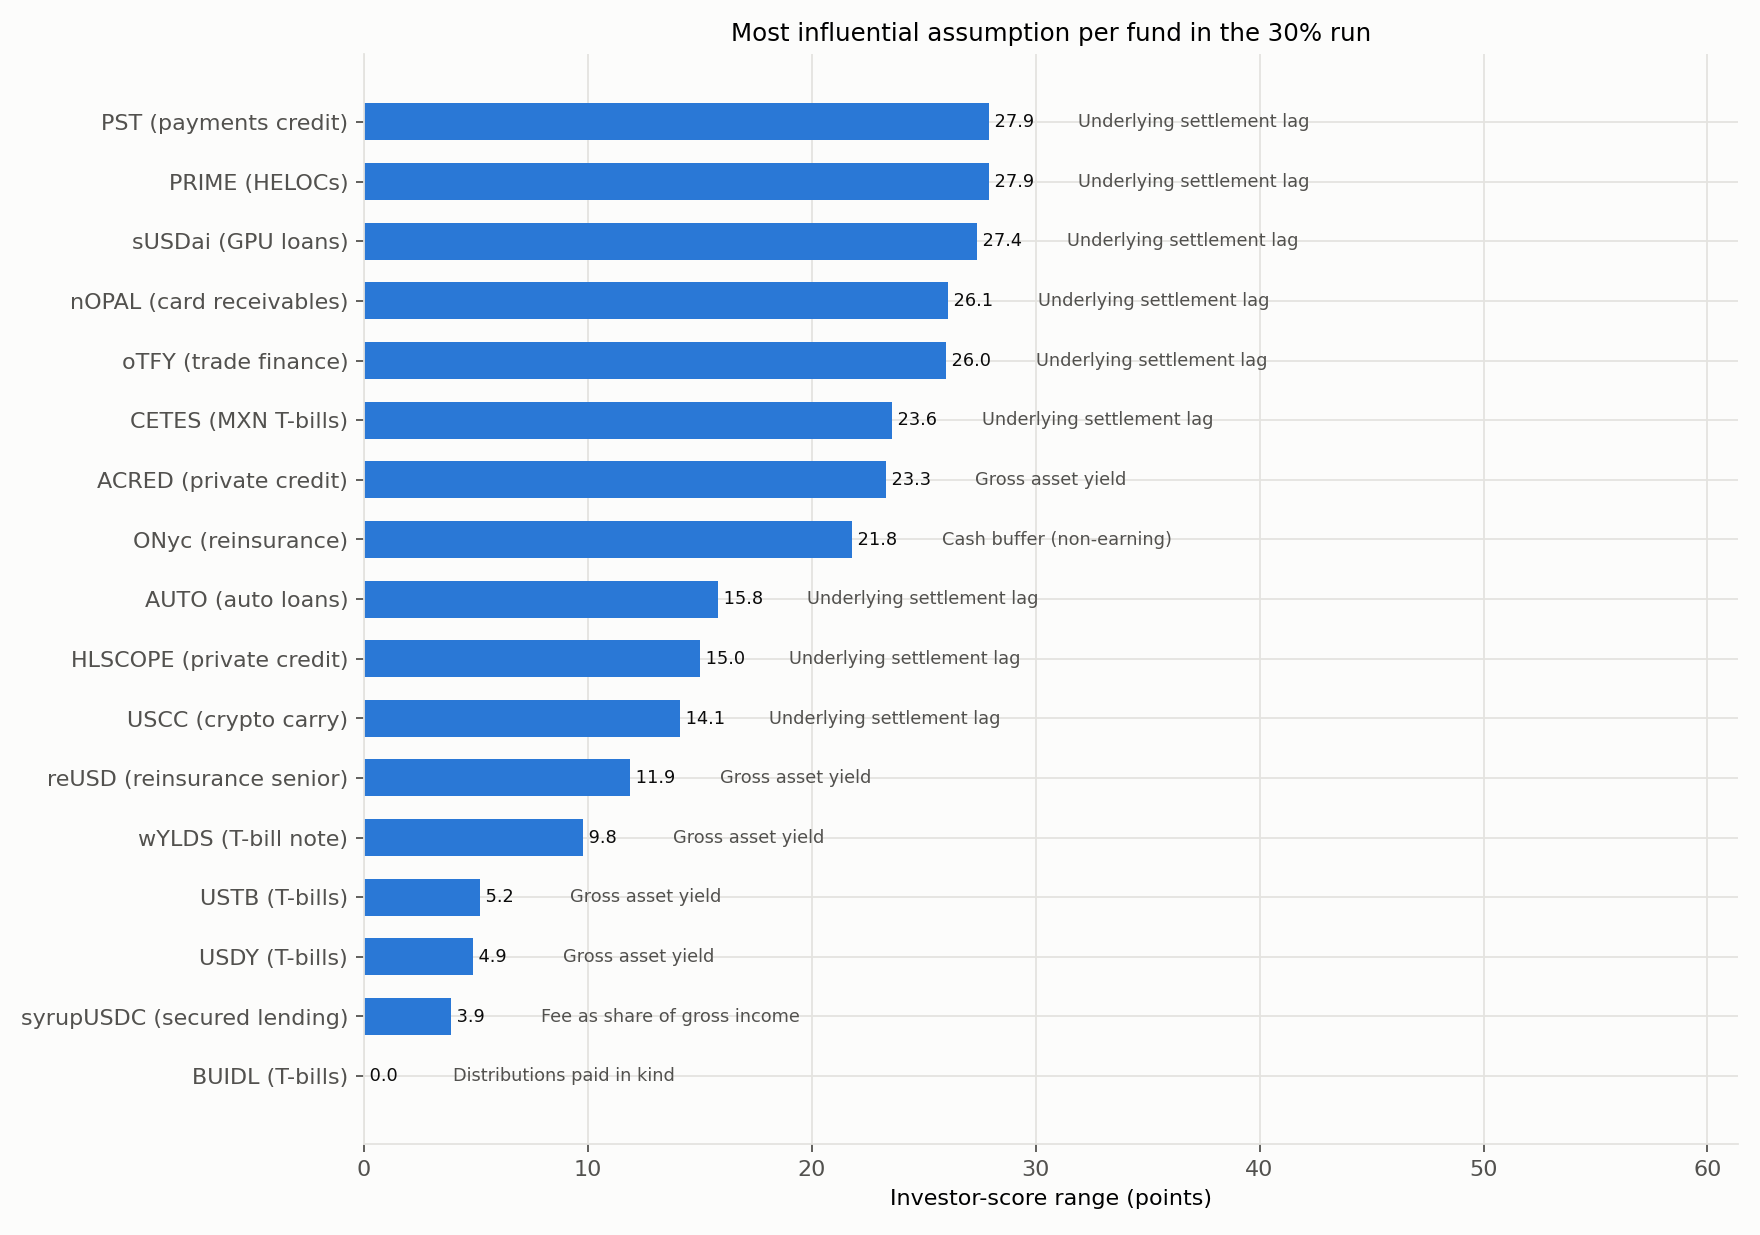
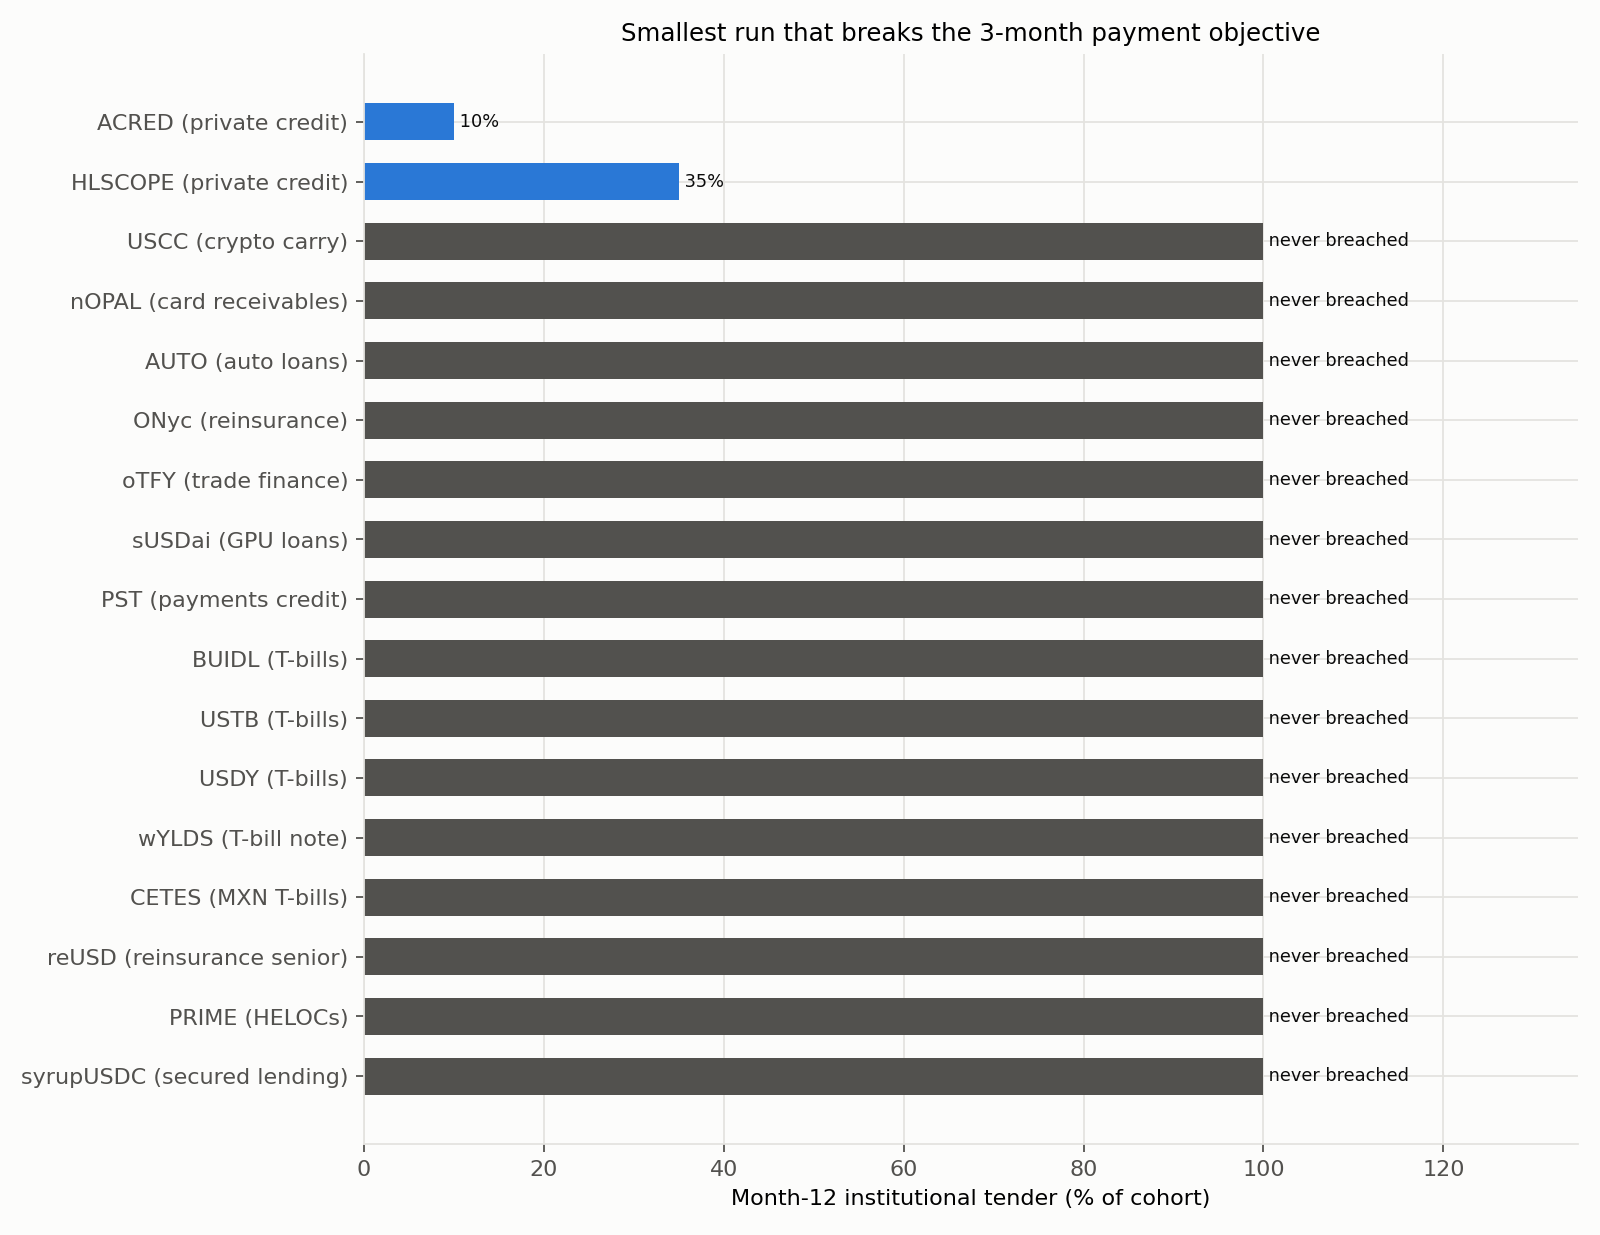
Look at Figure 7 and Figure 8: for almost every credit fund, the single most consequential variable in a run is the underlying asset settlement lag or the uninvested cash buffer—the exact operational numbers that smaller issuers rarely disclose. And when you flip the lens to sponsor break-even economics (assuming a standalone $210k fixed annual operating cost base), large funds like USDY ($2,380.0M AUM vs $55.3M break-even, 43.1× headroom), ONyc ($301.0M vs $7.7M, 39.2× headroom), syrupUSDC ($958.8M vs $26.6M, 36.1× headroom), and BUIDL ($2,160.0M vs $131.2M, 16.5× headroom) are massively self-sustaining. Meanwhile, small on-chain feeders like HLSCOPE ($4.2M documented tokenised AUM vs $55.3M standalone break-even, 0.1× headroom) and CETES ($4.3M vs $55.3M, 0.1× headroom) score 0/100 on standalone sponsor viability—meaning they only survive if subsidised by a larger parent fund or platform.
My Personal Playbook for RWA Allocators and DeFi Builders
1. If you are a DAO treasury, family office, or institutional allocator: Never buy an RWA token based on headline APY and a 24/7 DEX pool alone. Demand three numbers in writing: the underlying asset settlement lag (λ), the monthly redemption gate (g), and the on-chain looped collateral share on Kamino/Loopscale. If you need guaranteed zero-wait liquidity in a crisis, stick to the 70.0-scoring Treasury-bill benchmarks (BUIDL, USTB, USDY, wYLDS).
2. If you are designing or auditing an RWA protocol: Stop using static spreadsheet APYs. Simulate your FIFO redemption queue, payment-date vs. request-date NAV pricing, and looped-holder cohort dynamics under stock-flow conservation before you list on a lending venue.
Disclaimer: All results in this essay and our paper are mathematical model outputs under stated assumptions, not forecasts, credit ratings, or investment advice.
Frequently Asked Questions on Tokenised RWA Funds & Solana Looping
1. Does tokenising a real-world-asset (RWA) fund on Solana or Ethereum make its underlying assets liquid?
No. Putting fund shares on a blockchain changes how shares are registered, transferred, and posted as collateral in DeFi, but the underlying loans, receivables, reinsurance contracts, and Treasury bills still settle on their real-world schedules (from 0 months for US Treasury bills to 1–3 months for private credit and reinsurance). When redemptions exceed ready cash, tokenisation translates illiquidity into FIFO redemption queue wait times and secondary-market price discounts.
2. Why did ONyc (reinsurance) drop 19.5 points in the Kamino looping unwind while AUTO (auto loans) dropped only 5.5 points?
From on-chain Kamino Lend and Loopscale state as of 2026-10-28, AUTO (auto loans) has 95% of its $103.0M AUM posted as collateral on Kamino, while ONyc (reinsurance) has 56% of its $301.0M AUM looped. Yet when looped holders unwind (60% in Month 12 and 20% in Month 13), ONyc’s investor score falls from 89.6 to 70.1 (-19.5 points, 3-month max wait, 2.64% exit discount), whereas AUTO falls only from 88.1 to 82.6 (-5.5 points, 1-month max wait, 0.57% exit discount). The decisive variable is asset settlement speed: AUTO’s near-prime auto loans settle in 1 month, whereas ONyc’s property-and-casualty reinsurance takes 3 months.
3. Which tokenised RWA funds ranked highest across all 9 market scenarios and 100 Monte Carlo paths?
Across 9 scenarios and 100 Monte Carlo repetitions per scenario (plus 20,000 Dirichlet weight and scale perturbation draws), USCC (crypto carry) ranks first with an across-scenario median (P50) investor score of 84.2 (P10/P90: 71.4 / 93.4; 62% rank-1 probability under local weight/scale perturbations), followed by nOPAL (card receivables) at 80.5, AUTO (auto loans) at 78.7, and ONyc (reinsurance) at 78.4. Treasury-bill benchmarks (BUIDL, USTB, USDY, wYLDS) score a rock-steady 70.0 across every scenario with 0-month wait, while gated private-credit funds (HLSCOPE at 57.5 and ACRED at 45.0) rank last due to 4-month and 17-month maximum queue waits in the 30% institutional run.
4. Do higher-yielding RWA tokens pay enough extra yield to compensate for forced-exit discounts and volatility?
In our central risk-compensation test (25% probability of forced exit at the worst discount, 0.3 price of risk over the 3.96% risk-free rate), 12 of the 13 higher-yielding funds pay a positive net margin over their required spread, while CETES (MXN T-bills) fails (-1.55% annual margin due to 7.61% peso FX volatility). However, expected credit losses in our simulation come solely from scenario write-downs (e.g., 0.30%/yr for AUTO) and likely understate historical baseline default rates for consumer, card, and GPU-backed loans.
5. Why must investor scores and sponsor break-even viability be separated in tokenomics audits?
When a composite scorecard mixes issuer profitability with investor utility, raising management or exit fees can artificially inflate a fund’s score. By separating the 4-pillar investor score (excess yield, exit speed/cost, capital stability, liquidity resilience) from sponsor viability, higher sponsor fees can never raise the investor score. Our sponsor model reveals that while giants like USDY ($2,380.0M AUM, 43.1× headroom) and BUIDL ($2,160.0M AUM, 16.5× headroom) sit far above break-even, smaller feeders like HLSCOPE ($4.2M AUM vs $55.3M break-even) and CETES ($4.3M AUM vs $55.3M break-even) sit at 0.1× headroom.
Bespoke Mathematical Tokenomics Design & Simulation
cadCAD differential equations and token velocity modeling to design antifragile, sustainable cryptoeconomies.